
Smith-Midland Corp. (SMID): Price and Financial Metrics
SMID Price/Volume Stats
| Current price | $36.79 | 52-week high | $48.87 |
| Prev. close | $37.61 | 52-week low | $14.00 |
| Day low | $36.35 | Volume | 14,400 |
| Day high | $39.21 | Avg. volume | 26,397 |
| 50-day MA | $40.88 | Dividend yield | N/A |
| 200-day MA | $30.75 | Market Cap | 193.41M |
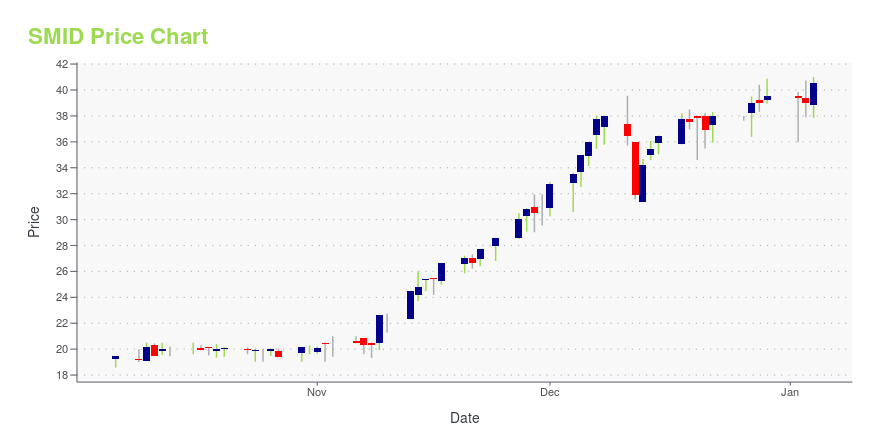
SMID Stock Price Chart Interactive Chart >
Smith-Midland Corp. (SMID) Company Bio
Smith-Midland Corp. engages in developing, manufacturing, marketing, leasing, licensing, selling, and installing of precast concrete products. The firm's products include SlenderWall Lightweight Construction Panels, Sierra Wall, J-J Hooks Highway Safety Barrier, Easi-Set Precast Buildings and Easi-Span Expandable Precast Buildings, Easi-Set Utility Vault, SoftSound Soundwall Panels, Beach Prisms Erosion Control Modules and Beach Prisms Erosion Control Modules. The company was founded by Rodney I. Smith and David G. Smith in 1960 and is headquartered in Midland, VA.
Latest SMID News From Around the Web
Below are the latest news stories about SMITH MIDLAND CORP that investors may wish to consider to help them evaluate SMID as an investment opportunity.
Smith-Midland Appoints New Members to its Board of DirectorsMIDLAND, VA / ACCESSWIRE / December 28, 2023 / Smith-Midland Corporation (NASDAQ:SMID), a provider of innovative, high-quality proprietary and patented precast concrete products and systems, has appointed Ms. Read Van de Water and Mr. Matthew Smith ... |
Owning 44% shares,institutional owners seem interested in Smith-Midland Corporation (NASDAQ:SMID),Key Insights Significantly high institutional ownership implies Smith-Midland's stock price is sensitive to their... |
Smith-Midland Receives $3.8M J-J Hooks Barrier Rental Contract for I-64 in VirginiaMIDLAND, VA / ACCESSWIRE / December 12, 2023 / Smith-Midland Corporation (NASDAQ:SMID), a provider of innovative, high-quality proprietary and patented precast concrete products and systems has begun renting its J-J Hooks precast concrete barrier ... |
Smith-Midland Producing Precast Utility Manholes for The Port of VirginiaMIDLAND, VA / ACCESSWIRE / November 30, 2023 / Smith-Midland Corporation (NASDAQ:SMID), a provider of innovative, high-quality proprietary and patented precast concrete products and systems, has begun production in their Virginia plant for $1.1 Million ... |
Smith-Midland (NASDAQ:SMID) shareholders notch a 27% CAGR over 5 years, yet earnings have been shrinkingThe most you can lose on any stock (assuming you don't use leverage) is 100% of your money. But when you pick a company... |
SMID Price Returns
| 1-mo | -16.00% |
| 3-mo | -10.25% |
| 6-mo | 89.97% |
| 1-year | 151.47% |
| 3-year | 199.59% |
| 5-year | 327.79% |
| YTD | -6.86% |
| 2023 | 92.68% |
| 2022 | -56.38% |
| 2021 | 397.35% |
| 2020 | 57.50% |
| 2019 | -19.79% |
Continue Researching SMID
Want to do more research on Smith Midland Corp's stock and its price? Try the links below:Smith Midland Corp (SMID) Stock Price | Nasdaq
Smith Midland Corp (SMID) Stock Quote, History and News - Yahoo Finance
Smith Midland Corp (SMID) Stock Price and Basic Information | MarketWatch
Loading social stream, please wait...