
Simpson Manufacturing Company, Inc. (SSD): Price and Financial Metrics
SSD Price/Volume Stats
| Current price | $182.05 | 52-week high | $218.38 |
| Prev. close | $178.80 | 52-week low | $110.40 |
| Day low | $180.32 | Volume | 380,240 |
| Day high | $183.64 | Avg. volume | 224,471 |
| 50-day MA | $197.20 | Dividend yield | 0.58% |
| 200-day MA | $169.51 | Market Cap | 7.73B |
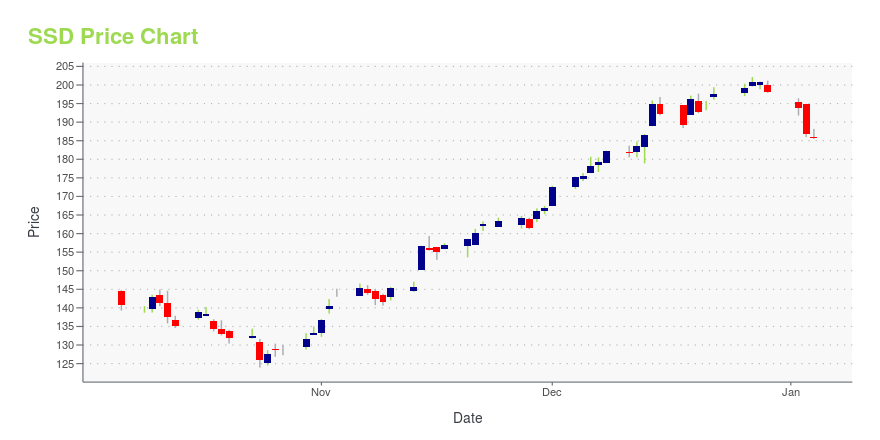
SSD Stock Price Chart Interactive Chart >
Simpson Manufacturing Company, Inc. (SSD) Company Bio
Simpson Manufacturing designs, engineers, manufactures, and sells building construction products. The Company also offers concrete construction products used for concrete, masonry, steel and for concrete repair, protection and strengthening, including adhesives, chemicals, mechanical anchors, carbide drill bits, powder actuated tools and fiber reinforced materials. The company was founded in 1956 and is based in Pleasanton, California.
Latest SSD News From Around the Web
Below are the latest news stories about SIMPSON MANUFACTURING CO INC that investors may wish to consider to help them evaluate SSD as an investment opportunity.
Simpson Manufacturing (NYSE:SSD) Is Aiming To Keep Up Its Impressive ReturnsDid you know there are some financial metrics that can provide clues of a potential multi-bagger? In a perfect world... |
Chart Of The Day: Simpson Manufacturing - Wood Is Still KingSimpson Manufacturing Co., Inc., through its subsidiaries, designs, engineers, manufactures and sells wood and concrete construction products. |
10 Best Lumber Stocks To Invest In 2023In this piece, we will take a look at the ten best lumber stocks to invest in 2023. If you want to skip our overview of the lumber industry and how recent developments are shaping it, then take a look at the 5 Best Lumber Stocks To Invest In 2023. Lumber has been one of […] |
Simpson Manufacturing Co. (SSD) Beat Earnings Expectations in Q3Conestoga Capital Advisors, an asset management company, released its “Small Cap Strategy” third-quarter 2023 investor letter. A copy of the same can be downloaded here. The Small Cap Composite returned -6.72% net-of-fees in the third quarter, compared to the Russell 2000 Growth Index’s -7.32% return. The strategy’s outperformance was driven by positive stock selection effects, while sector […] |
Simpson Manufacturing Co., Inc. Announces Participation at Baird's 2023 Global Industrial ConferenceSimpson Manufacturing Co., Inc. (the "Company") (NYSE: SSD), an industry leader in engineered structural connectors and building solutions, announced today that Mike Olosky, Chief Executive Officer, and Brian Magstadt, Chief Financial Officer and Treasurer, will participate in the upcoming Baird 2023 Global Industrial Conference on Wednesday, November 8, 2023, at The Ritz-Carlton in Chicago, Illinois. Simpson is scheduled to present at 1:10 p.m. CT and will participate in meetings with investors |
SSD Price Returns
| 1-mo | -7.85% |
| 3-mo | -0.02% |
| 6-mo | 38.40% |
| 1-year | 62.17% |
| 3-year | 74.23% |
| 5-year | 200.72% |
| YTD | -7.79% |
| 2023 | 125.36% |
| 2022 | -35.62% |
| 2021 | 50.20% |
| 2020 | 17.51% |
| 2019 | 50.84% |
SSD Dividends
| Ex-Dividend Date | Type | Payout Amount | Change | ||||||
|---|---|---|---|---|---|---|---|---|---|
| Loading, please wait... | |||||||||
Continue Researching SSD
Want to do more research on Simpson Manufacturing Co Inc's stock and its price? Try the links below:Simpson Manufacturing Co Inc (SSD) Stock Price | Nasdaq
Simpson Manufacturing Co Inc (SSD) Stock Quote, History and News - Yahoo Finance
Simpson Manufacturing Co Inc (SSD) Stock Price and Basic Information | MarketWatch
Loading social stream, please wait...