
Summit Materials, Inc. (SUM): Price and Financial Metrics
SUM Price/Volume Stats
| Current price | $39.03 | 52-week high | $44.89 |
| Prev. close | $39.50 | 52-week low | $26.18 |
| Day low | $38.88 | Volume | 1,040,800 |
| Day high | $40.44 | Avg. volume | 975,539 |
| 50-day MA | $41.53 | Dividend yield | N/A |
| 200-day MA | $36.90 | Market Cap | 6.80B |
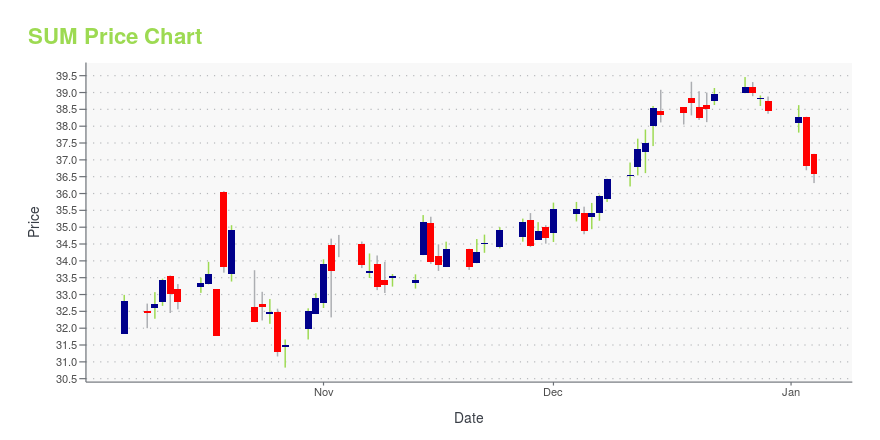
SUM Stock Price Chart Interactive Chart >
Summit Materials, Inc. (SUM) Company Bio
Summit Materials supplies aggregates, cement, ready-mixed concrete and asphalt in the United States and British Columbia, Canada. The company was founded in 2009 and is based in Denver, Colorado.
Latest SUM News From Around the Web
Below are the latest news stories about SUMMIT MATERIALS INC that investors may wish to consider to help them evaluate SUM as an investment opportunity.
Are Investors Undervaluing Summit Materials (SUM) Right Now?Here at Zacks, our focus is on the proven Zacks Rank system, which emphasizes earnings estimates and estimate revisions to find great stocks. Nevertheless, we are always paying attention to the latest value, growth, and momentum trends to underscore strong picks. |
Summit Materials Announces Pricing of $800 Million of 7.250% Senior Notes Due 2031Summit Materials, Inc. (NYSE: SUM, "Summit") announced today that its indirect subsidiaries Summit Materials, LLC and Summit Materials Finance Corp. (the "Issuers", and, together with Summit, the "Company") finalized the terms of the previously announced offering of $800.0 million aggregate principal amount of Senior Notes due 2031 (the "notes"). Summit anticipates that consummation of the offering will occur on December 14, 2023, subject to customary closing conditions. The Company intends to u |
SUMMIT MATERIALS ANNOUNCES INTENTION TO OFFER $800 MILLION OF SENIOR NOTESSummit Materials, Inc. (NYSE: SUM, "Summit") announced today that its indirect subsidiaries Summit Materials, LLC and Summit Materials Finance Corp. (the "Issuers", and, together with Summit, the "Company") intend to offer $800.0 million aggregate principal amount of Senior Notes due 2031 (the "notes"). The Company intends to use the proceeds from the offering, together with borrowings under a new term loan B facility, to finance the previously announced transaction with Cementos Argos S.A. to a |
When Should You Buy Summit Materials, Inc. (NYSE:SUM)?Summit Materials, Inc. ( NYSE:SUM ), might not be a large cap stock, but it saw a double-digit share price rise of over... |
Is Summit Materials, Inc. (NYSE:SUM) Worth US$33.9 Based On Its Intrinsic Value?Key Insights The projected fair value for Summit Materials is US$25.40 based on 2 Stage Free Cash Flow to Equity Summit... |
SUM Price Returns
| 1-mo | -5.34% |
| 3-mo | 8.03% |
| 6-mo | 11.74% |
| 1-year | 44.50% |
| 3-year | 32.57% |
| 5-year | 142.72% |
| YTD | 1.48% |
| 2023 | 35.47% |
| 2022 | -29.27% |
| 2021 | 99.90% |
| 2020 | -15.98% |
| 2019 | 92.74% |
Continue Researching SUM
Here are a few links from around the web to help you further your research on Summit Materials Inc's stock as an investment opportunity:Summit Materials Inc (SUM) Stock Price | Nasdaq
Summit Materials Inc (SUM) Stock Quote, History and News - Yahoo Finance
Summit Materials Inc (SUM) Stock Price and Basic Information | MarketWatch
Loading social stream, please wait...