Tarsus Pharmaceuticals Inc. (TARS): Price and Financial Metrics
TARS Price/Volume Stats
Current price | $16.75 | 52-week high | $19.66 |
Prev. close | $15.76 | 52-week low | $11.33 |
Day low | $15.72 | Volume | 248,600 |
Day high | $17.00 | Avg. volume | 117,239 |
50-day MA | $14.30 | Dividend yield | N/A |
200-day MA | $15.49 | Market Cap | 448.97M |
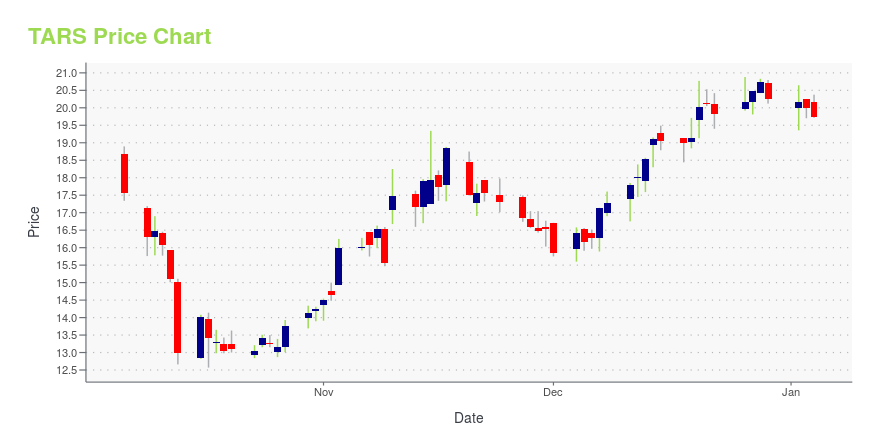
TARS Stock Price Chart Interactive Chart >
TARS POWR Grades
- TARS scores best on the Sentiment dimension, with a Sentiment rank ahead of 84.7% of US stocks.
- TARS's strongest trending metric is Quality; it's been moving up over the last 179 days.
- TARS's current lowest rank is in the Growth metric (where it is better than 21.84% of US stocks).
TARS Stock Summary
- TARSUS PHARMACEUTICALS INC's stock had its IPO on October 16, 2020, making it an older stock than merely 12.54% of US equities in our set.
- TARS's price/sales ratio is 15.55; that's higher than the P/S ratio of 93.07% of US stocks.
- Equity multiplier, or assets relative to shareholders' equity, comes in at 1.17 for TARSUS PHARMACEUTICALS INC; that's greater than it is for merely 12.48% of US stocks.
- If you're looking for stocks that are quantitatively similar to TARSUS PHARMACEUTICALS INC, a group of peers worth examining would be CERS, ASTC, ENTX, LCTX, and LQDA.
- TARS's SEC filings can be seen here. And to visit TARSUS PHARMACEUTICALS INC's official web site, go to www.tarsusrx.com.
TARS Valuation Summary
- In comparison to the median Healthcare stock, TARS's price/earnings ratio is 128.22% lower, now standing at -6.8.
- TARS's price/sales ratio has moved NA NA over the prior 32 months.
Below are key valuation metrics over time for TARS.
Stock | Date | P/S | P/B | P/E | EV/EBIT |
---|---|---|---|---|---|
TARS | 2023-05-23 | 15.9 | 2.6 | -6.8 | -6.4 |
TARS | 2023-05-22 | 15.7 | 2.5 | -6.7 | -6.2 |
TARS | 2023-05-19 | 15.6 | 2.5 | -6.6 | -6.2 |
TARS | 2023-05-18 | 15.6 | 2.5 | -6.6 | -6.2 |
TARS | 2023-05-17 | 15.4 | 2.5 | -6.5 | -6.1 |
TARS | 2023-05-16 | 15.7 | 2.5 | -6.7 | -6.3 |
TARS's Quality Factors
The “Quality” component of the POWR Ratings focuses on 31 different factors of a companies fundamentals and operational strength. Here are some key insights as we drill into the specifics of these quality attributes.- TARS has a Quality Grade of B, ranking ahead of 79.3% of graded US stocks.
- TARS's asset turnover comes in at 0.335 -- ranking 138th of 682 Pharmaceutical Products stocks.
- 500 - Internal server error
The table below shows TARS's key quality metrics over time.
Period | Asset Turnover | Gross Margin | ROIC |
---|---|---|---|
2021-06-30 | 0.335 | 0.963 | -0.432 |
TARS Price Target
For more insight on analysts targets of TARS, see our TARS price target page. And for a list of of all stocks sorted by upside potential based on analyst target price, see our Top Price Target page.
Average Price Target | $53.80 | Average Broker Recommendation | 1.1 (Strong Buy) |
Tarsus Pharmaceuticals Inc. (TARS) Company Bio
Tarsus is a clinical-stage biopharmaceutical company headquartered in Irvine, California. Tarsus was founded in 2017 to bring innovative therapies to a range of diseases in need of better solutions, starting with Demodex blepharitis and eye care.
Latest TARS News From Around the Web
Below are the latest news stories about TARSUS PHARMACEUTICALS INC that investors may wish to consider to help them evaluate TARS as an investment opportunity.
Tarsus Reports First Quarter 2023 Financial Results and Recent Business AchievementsContinuing to build market awareness through disease education and deploying commercial leadership in anticipation of TP-03 August 25, 2023 PDUFA Presented health economics data suggesting a costly and substantial burden of illness in patients with Demodex blepharitis Tarsus to host investor webcast highlighting planned commercialization strategy and opportunity for TP-03 in Demodex blepharitis on Thursday, June 15, 2023 IRVINE, Calif., May 09, 2023 (GLOBE NEWSWIRE) -- Tarsus Pharmaceuticals, In |
Tarsus Launches “Don’t Freak Out. Get Checked Out.” Campaign During Healthy Vision Month to Encourage Patients with Demodex Blepharitis to Visit Eye Care ProvidersDemodex blepharitis is a highly prevalent, yet often undiagnosed eyelid disease that impacts approximately 25 million eye care patients in the U.S. IRVINE, Calif., May 08, 2023 (GLOBE NEWSWIRE) -- Tarsus Pharmaceuticals, Inc. (NASDAQ: TARS), whose mission is to focus on unmet needs and apply proven science and new technology to revolutionize treatment for patients, starting with eye care, today announced the launch of “Don’t Freak Out. Get Checked Out.”, a disease education campaign designed to |
Shareholders Should Be Pleased With Tarsus Pharmaceuticals, Inc.'s (NASDAQ:TARS) PriceTarsus Pharmaceuticals, Inc.'s ( NASDAQ:TARS ) price-to-sales (or "P/S") ratio of 15.7x might make it look like a... |
Tarsus to Participate at the Bank of America 2023 Healthcare ConferenceIRVINE, Calif., May 03, 2023 (GLOBE NEWSWIRE) -- Tarsus Pharmaceuticals, Inc. (NASDAQ: TARS), whose mission is to focus on unmet needs and apply proven science and new technology to revolutionize treatment for patients, starting with eye care, today announced that Bobak Azamian, M.D., Ph.D., Chief Executive Officer and Chairman of Tarsus and Jeff Farrow, Chief Financial and Strategy Officer, will participate in 1:1 meetings at the Bank of America 2023 Healthcare Conference taking place in Las Ve |
Tarsus Appoints Jeff Farrow as Chief Financial Officer and Chief Strategy OfficerIRVINE, Calif., April 24, 2023 (GLOBE NEWSWIRE) -- Tarsus Pharmaceuticals, Inc. (NASDAQ: TARS), whose mission is to focus on unmet needs and apply proven science and new technology to revolutionize treatment for patients, starting with eye care, today announced the appointment of Jeff Farrow as Chief Financial Officer and Chief Strategy Officer, effective immediately. Mr. Farrow succeeds Leo Greenstein who served as CFO since 2020 and will be leaving Tarsus to pursue other professional interests |
TARS Price Returns
1-mo | 15.36% |
3-mo | 11.97% |
6-mo | -3.68% |
1-year | 22.71% |
3-year | N/A |
5-year | N/A |
YTD | 14.26% |
2022 | -34.84% |
2021 | -45.56% |
2020 | N/A |
2019 | N/A |
2018 | N/A |
Loading social stream, please wait...