
Teva Pharmaceutical Industries Ltd. ADR (TEVA): Price and Financial Metrics
TEVA Price/Volume Stats
| Current price | $12.86 | 52-week high | $14.47 |
| Prev. close | $12.78 | 52-week low | $7.09 |
| Day low | $12.51 | Volume | 10,124,900 |
| Day high | $13.01 | Avg. volume | 10,678,654 |
| 50-day MA | $13.44 | Dividend yield | N/A |
| 200-day MA | $10.67 | Market Cap | 14.42B |
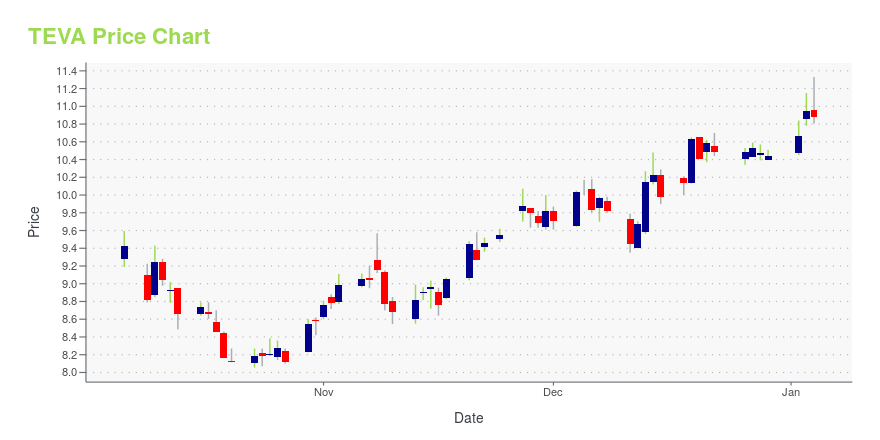
TEVA Stock Price Chart Interactive Chart >
Teva Pharmaceutical Industries Ltd. ADR (TEVA) Company Bio
Teva Pharmaceutical Industries Ltd is a pharmaceutical company which develops, produces, and markets, generic and specialty medicines which include chemical and therapeutic medicines in a variety of dosage forms and central nervous system medicines. Established in 1901, the company markets 3,500 generic and proprietary products to 60 countries worldwide. Teva competes against other large pharmaceutical companies such as Pfizer, Merck, Novartis, and GlaxoSmithKline. Kare Schulz currently serves as Teva’s President, Chairman of the Board, and Chief Executive Officer, overseeing an international workforce of around 38,000 employees.
Latest TEVA News From Around the Web
Below are the latest news stories about TEVA PHARMACEUTICAL INDUSTRIES LTD that investors may wish to consider to help them evaluate TEVA as an investment opportunity.
Teva to Present at the 42nd Annual J.P. Morgan Healthcare ConferenceTEL AVIV, Israel, December 28, 2023--Teva Pharmaceutical Industries Ltd. (NYSE and TASE: TEVA) today announced that Richard Francis, Teva's President and CEO, will present at the 42nd Annual J.P. Morgan Healthcare Conference on Monday, January 8, 2024. The presentation will begin at 8:15 A.M. Pacific Time (11:15 A.M. Eastern Time). |
HSBC Sees Opportunity in These 2 Biopharma Giants Ahead of the 2024 ElectionsThe silly season is upon us. Not the holidays – but the election. We’re less than 11 months out from the Presidential vote, and the first primary, the Iowa GOP caucus, is less than 30 days away. Election years are the ‘known unknown’ of the US economy. We know they’re coming, we know the results can change everything, we know that every economic sector will react differently – but we never truly know how those changes will shake out. This cyclical truth of politics and financial markets informs |
Here’s Why Teva Pharmaceutical Industries Limited (TEVA) Rose in Q3Sound Shore Management, an investment management firm, has released its investor letter for the third quarter of 2023. A copy of the same can be downloaded here. In the third quarter, the Sound Shore Fund Investor Class (SSHFX) and Institutional Class (SSHVX) declined 2.01% and 1.94%, respectively outperforming the Russell 1000 Value Index (Russell Value) which […] |
My 5 Largest Portfolio Holdings for 2024This mix of growth and value stocks appears set to outperform -- and hopefully makes me a lot richer in the process. |
Teva and Biolojic Design Announce Exclusive License Agreement for the Development of a Therapeutic Antibody for Atopic Dermatitis and AsthmaTEL AVIV, Israel, December 14, 2023--Teva Pharmaceutical Industries Ltd., (NYSE and TASE:TEVA) and Biolojic Design Ltd. ("Biolojic"), a biotechnology company that uses computational biology and artificial intelligence to transform antibodies into intelligent medicinal solutions, today announced an exclusive license agreement to develop a potential novel antibody-based therapy for the treatment of Atopic Dermatitis and Asthma. |
TEVA Price Returns
| 1-mo | -6.47% |
| 3-mo | 15.03% |
| 6-mo | 57.21% |
| 1-year | 54.01% |
| 3-year | 25.46% |
| 5-year | -12.52% |
| YTD | 23.18% |
| 2023 | 14.47% |
| 2022 | 13.86% |
| 2021 | -16.99% |
| 2020 | -1.53% |
| 2019 | -36.45% |
Continue Researching TEVA
Want to see what other sources are saying about Teva Pharmaceutical Industries Ltd's financials and stock price? Try the links below:Teva Pharmaceutical Industries Ltd (TEVA) Stock Price | Nasdaq
Teva Pharmaceutical Industries Ltd (TEVA) Stock Quote, History and News - Yahoo Finance
Teva Pharmaceutical Industries Ltd (TEVA) Stock Price and Basic Information | MarketWatch
Loading social stream, please wait...