
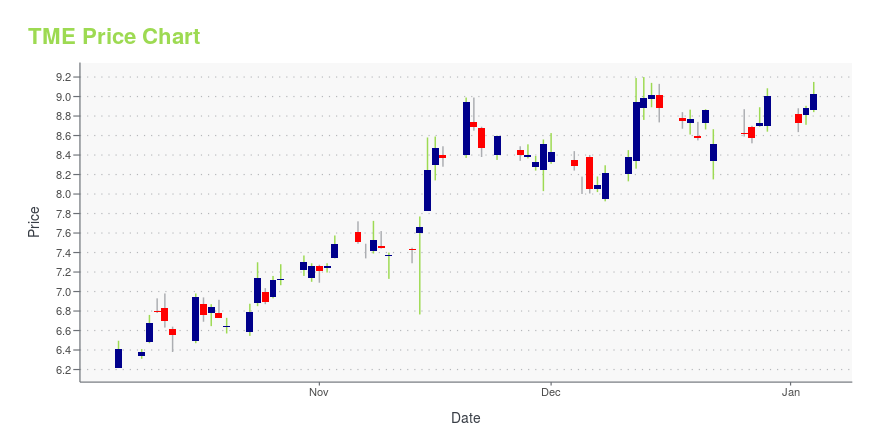
Tencent Music Entertainment Group ADR (TME): Price and Financial Metrics
TME Price/Volume Stats
| Current price | $11.25 | 52-week high | $12.00 |
| Prev. close | $11.24 | 52-week low | $5.70 |
| Day low | $10.94 | Volume | 8,543,700 |
| Day high | $11.38 | Avg. volume | 8,738,717 |
| 50-day MA | $10.61 | Dividend yield | N/A |
| 200-day MA | $8.26 | Market Cap | 19.31B |
TME Stock Price Chart Interactive Chart >
Tencent Music Entertainment Group ADR (TME) Company Bio
Tencent Music Entertainment Group (Chinese: 腾讯音乐娱乐集团) is a company that develops music streaming services for the Chinese market. Tencent Music's apps include QQ Music, Kugou, Kuwo, and WeSing; which have more than 800 million active users and 120 million paying subscribers. As of July 2016, Tencent Music's three services held an estimated 56% market share of music streaming services in China. (Source:Wikipedia)
Latest TME News From Around the Web
Below are the latest news stories about TENCENT MUSIC ENTERTAINMENT GROUP that investors may wish to consider to help them evaluate TME as an investment opportunity.
Asian Market Mavericks: 7 Stocks Defining the Future of Asia’s EconomyNavigating Asia's financial boom. |
15 Stocks That Will Make You Rich in 5 Years According to ChatGPTIn this article, we will take a detailed look at the 15 Stocks That Will Make You Rich in 5 Years According to ChatGPT. For a quick overview of such stocks, read our article 5 Stocks That Will Make You Rich in 5 Years According to ChatGPT. All anyone in the Wall Street could talk about […] |
Tencent Music Entertainment Group Sponsored ADR (TME) Just Overtook the 20-Day Moving AverageGood things could be on the horizon when a stock surpasses the 20-day simple moving average. How should investors react? |
21 Most Valuable Media Companies In The WorldIn this article, we will take a detailed look at the 21 Most Valuable Media Companies In The World with insights into market capitalization. To see the top five countries in the list, click 5 Most Valuable Media Companies In The World. The media industry comprises multiple segments: movies/cinema, television, music, publishing, radio, internet, advertising, and gaming. Trends and […] |
Tencent Music Entertainment Group Sponsored ADR (TME) Just Flashed Golden Cross Signal: Do You Buy?Is it a good or bad thing when a stock experiences a golden cross technical event? |
TME Price Returns
| 1-mo | 8.38% |
| 3-mo | 28.57% |
| 6-mo | 69.17% |
| 1-year | 38.38% |
| 3-year | -37.64% |
| 5-year | -38.25% |
| YTD | 24.86% |
| 2023 | 8.82% |
| 2022 | 20.88% |
| 2021 | -64.40% |
| 2020 | 63.88% |
| 2019 | -11.20% |
Loading social stream, please wait...