Tetra Tech, Inc. (TTEK): Price and Financial Metrics
TTEK Price/Volume Stats
Current price | $152.03 | 52-week high | $173.27 |
Prev. close | $154.53 | 52-week low | $122.86 |
Day low | $150.96 | Volume | 457,400 |
Day high | $155.34 | Avg. volume | 299,976 |
50-day MA | $161.13 | Dividend yield | 0.68% |
200-day MA | $151.24 | Market Cap | 8.05B |
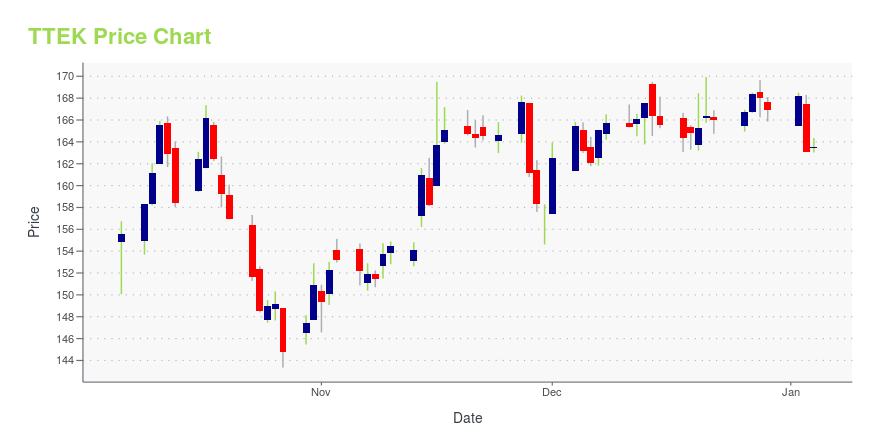
TTEK Stock Price Chart Interactive Chart >
TTEK POWR Grades
- Quality is the dimension where TTEK ranks best; there it ranks ahead of 85.11% of US stocks.
- The strongest trend for TTEK is in Stability, which has been heading down over the past 177 days.
- TTEK's current lowest rank is in the Value metric (where it is better than 4.45% of US stocks).
TTEK Stock Summary
- TTEK's went public 31.8 years ago, making it older than 83.43% of listed US stocks we're tracking.
- The price/operating cash flow metric for TETRA TECH INC is higher than 84.78% of stocks in our set with a positive cash flow.
- With a year-over-year growth in debt of 141.96%, TETRA TECH INC's debt growth rate surpasses 92.06% of about US stocks.
- If you're looking for stocks that are quantitatively similar to TETRA TECH INC, a group of peers worth examining would be PLXS, G, EDR, CRL, and ALTO.
- Visit TTEK's SEC page to see the company's official filings. To visit the company's web site, go to www.tetratech.com.
TTEK Valuation Summary
- TTEK's price/earnings ratio is 27.8; this is 49.46% higher than that of the median Industrials stock.
- TTEK's price/sales ratio has moved up 0.6 over the prior 243 months.
Below are key valuation metrics over time for TTEK.
Stock | Date | P/S | P/B | P/E | EV/EBIT |
---|---|---|---|---|---|
TTEK | 2023-09-19 | 2.0 | 5.8 | 27.8 | 20.6 |
TTEK | 2023-09-18 | 2.1 | 5.9 | 28.3 | 20.9 |
TTEK | 2023-09-15 | 2.0 | 5.8 | 28.0 | 20.7 |
TTEK | 2023-09-14 | 2.0 | 5.7 | 27.5 | 20.3 |
TTEK | 2023-09-13 | 2.0 | 5.7 | 27.1 | 20.1 |
TTEK | 2023-09-12 | 2.0 | 5.7 | 27.2 | 20.2 |
TTEK Growth Metrics
- The 5 year net cashflow from operations growth rate now stands at 18.7%.
- The 4 year revenue growth rate now stands at 17.27%.
- The 2 year net income to common stockholders growth rate now stands at 77.47%.

The table below shows TTEK's growth in key financial areas (numbers in millions of US dollars).
Date | Revenue | Operating Cash Flow | Net Income to Common Stock |
---|---|---|---|
2022-12-31 | 3,540.304 | 278.96 | 311.342 |
2022-09-30 | 3,504.048 | 336.188 | 263.125 |
2022-06-30 | 3,493.498 | 353.81 | 263.133 |
2022-03-31 | 3,404.9 | 324.497 | 256.386 |
2021-12-31 | 3,306.92 | 353.611 | 248.863 |
2021-09-30 | 3,213.513 | 304.372 | 232.81 |
TTEK's Quality Factors
The “Quality” component of the POWR Ratings focuses on 31 different factors of a companies fundamentals and operational strength. Here are some key insights as we drill into the specifics of these quality attributes.- TTEK has a Quality Grade of B, ranking ahead of 91.19% of graded US stocks.
- TTEK's asset turnover comes in at 1.26 -- ranking 80th of 561 Business Services stocks.
- BGSF, CSGP, and SABR are the stocks whose asset turnover ratios are most correlated with TTEK.
The table below shows TTEK's key quality metrics over time.
Period | Asset Turnover | Gross Margin | ROIC |
---|---|---|---|
2021-06-27 | 1.260 | 0.156 | 0.279 |
2021-03-28 | 1.251 | 0.157 | 0.266 |
2020-12-27 | 1.257 | 0.153 | 0.238 |
2020-09-27 | 1.279 | 0.149 | 0.228 |
2020-06-28 | 1.350 | 0.135 | 0.203 |
2020-03-29 | 1.431 | 0.131 | 0.214 |
TTEK Price Target
For more insight on analysts targets of TTEK, see our TTEK price target page. And for a list of of all stocks sorted by upside potential based on analyst target price, see our Top Price Target page.
Average Price Target | $155.14 | Average Broker Recommendation | 1.62 (Moderate Buy) |
Tetra Tech, Inc. (TTEK) Company Bio
Tetra Tech is a provider of consulting, engineering, program management, and construction management services. The Company supports commercial and government clients focused on water, environment, infrastructure, resource management, and energy. The company was founded in 1966 and is based in Pasadena, California.
Latest TTEK News From Around the Web
Below are the latest news stories about TETRA TECH INC that investors may wish to consider to help them evaluate TTEK as an investment opportunity.
Tetra Tech (TTEK) Gains 20.1% in a Year: Will the Upside Last?Increased environmental services and digital water programs within the GSG unit bode well for Tetra Tech (TTEK). The company's measures to reward its shareholders are impressive. |
Is It Time To Consider Buying Tetra Tech, Inc. (NASDAQ:TTEK)?Tetra Tech, Inc. ( NASDAQ:TTEK ), might not be a large cap stock, but it saw significant share price movement during... |
Why Is Tetra (TTEK) Down 5.3% Since Last Earnings Report?Tetra (TTEK) reported earnings 30 days ago. What's next for the stock? We take a look at earnings estimates for some clues. |
A Look At The Intrinsic Value Of Tetra Tech, Inc. (NASDAQ:TTEK)Key Insights Using the 2 Stage Free Cash Flow to Equity, Tetra Tech fair value estimate is US$154 With US$158 share... |
Is Tetra (TTEK) a Solid Growth Stock? 3 Reasons to Think "Yes"Tetra (TTEK) could produce exceptional returns because of its solid growth attributes. |
TTEK Price Returns
1-mo | -3.38% |
3-mo | -7.00% |
6-mo | 4.32% |
1-year | 19.06% |
3-year | 62.11% |
5-year | 130.85% |
YTD | 5.24% |
2022 | -13.96% |
2021 | 47.46% |
2020 | 35.34% |
2019 | 67.76% |
2018 | 8.39% |
TTEK Dividends
Ex-Dividend Date | Type | Payout Amount | Change | ||||||
---|---|---|---|---|---|---|---|---|---|
Loading, please wait... |
Continue Researching TTEK
Want to do more research on Tetra Tech Inc's stock and its price? Try the links below:Tetra Tech Inc (TTEK) Stock Price | Nasdaq
Tetra Tech Inc (TTEK) Stock Quote, History and News - Yahoo Finance
Tetra Tech Inc (TTEK) Stock Price and Basic Information | MarketWatch
Loading social stream, please wait...