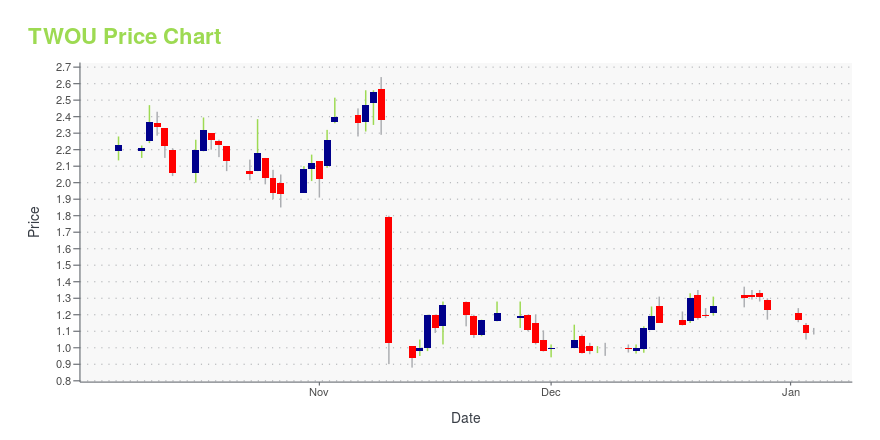
2U, Inc. (TWOU): Price and Financial Metrics
TWOU Price/Volume Stats
Current price | $1.19 | 52-week high | $13.15 |
Prev. close | $1.21 | 52-week low | $0.88 |
Day low | $1.12 | Volume | 1,571,100 |
Day high | $1.28 | Avg. volume | 1,423,876 |
50-day MA | $2.02 | Dividend yield | N/A |
200-day MA | $4.32 | Market Cap | 97.66M |
TWOU Stock Price Chart Interactive Chart >
TWOU POWR Grades
- TWOU scores best on the Value dimension, with a Value rank ahead of 82.96% of US stocks.
- The strongest trend for TWOU is in Quality, which has been heading down over the past 177 days.
- TWOU's current lowest rank is in the Sentiment metric (where it is better than 2.2% of US stocks).
TWOU Stock Summary
- TWOU's price/sales ratio is 0.09; that's higher than the P/S ratio of just 2.66% of US stocks.
- In terms of volatility of its share price, TWOU is more volatile than 93.25% of stocks we're observing.
- Shareholder yield, a measure of how much is returned to shareholders via dividends and share repurchases, for TWOU comes in at 87.79% -- higher than that of 97.67% of stocks in our set.
- Stocks that are quantitatively similar to TWOU, based on their financial statements, market capitalization, and price volatility, are CARS, HCTI, ISPC, AGCO, and SHCR.
- Visit TWOU's SEC page to see the company's official filings. To visit the company's web site, go to 2u.com.
TWOU Valuation Summary
- In comparison to the median Consumer Defensive stock, TWOU's price/earnings ratio is 102.5% lower, now standing at -0.5.
- TWOU's price/sales ratio has moved down 6.4 over the prior 117 months.
Below are key valuation metrics over time for TWOU.
Stock | Date | P/S | P/B | P/E | EV/EBIT |
---|---|---|---|---|---|
TWOU | 2023-11-06 | 0.2 | 0.7 | -0.5 | -3.7 |
TWOU | 2023-11-03 | 0.2 | 0.7 | -0.5 | -3.7 |
TWOU | 2023-11-02 | 0.2 | 0.6 | -0.5 | -3.7 |
TWOU | 2023-11-01 | 0.2 | 0.6 | -0.5 | -3.6 |
TWOU | 2023-10-31 | 0.2 | 0.6 | -0.5 | -3.7 |
TWOU | 2023-10-30 | 0.2 | 0.6 | -0.5 | -3.7 |
TWOU Growth Metrics
- Its 4 year revenue growth rate is now at 181.26%.
- The 3 year net cashflow from operations growth rate now stands at -53.23%.
- The 2 year net cashflow from operations growth rate now stands at 12.09%.

The table below shows TWOU's growth in key financial areas (numbers in millions of US dollars).
Date | Revenue | Operating Cash Flow | Net Income to Common Stock |
---|---|---|---|
2022-12-31 | 963.08 | 10.927 | -322.151 |
2022-09-30 | 970.655 | -16.38 | -377.569 |
2022-06-30 | 970.793 | 12.764 | -316.003 |
2022-03-31 | 966.538 | -25.767 | -274.982 |
2021-12-31 | 945.682 | -18.074 | -194.766 |
2021-09-30 | 917.352 | 33.326 | -165.162 |
TWOU's Quality Factors
The “Quality” component of the POWR Ratings focuses on 31 different factors of a companies fundamentals and operational strength. Here are some key insights as we drill into the specifics of these quality attributes.- TWOU has a Quality Grade of C, ranking ahead of 69.35% of graded US stocks.
- TWOU's asset turnover comes in at 0.529 -- ranking 309th of 561 Business Services stocks.
- MEDP, NEWR, and FALC are the stocks whose asset turnover ratios are most correlated with TWOU.
The table below shows TWOU's key quality metrics over time.
Period | Asset Turnover | Gross Margin | ROIC |
---|---|---|---|
2021-06-30 | 0.529 | 0.704 | -0.230 |
2021-03-31 | 0.565 | 0.700 | -0.404 |
2020-12-31 | 0.562 | 0.698 | -0.448 |
2020-09-30 | 0.561 | 0.696 | -0.477 |
2020-06-30 | 0.561 | 0.696 | -0.686 |
2020-03-31 | 0.511 | 0.703 | -0.650 |
TWOU Price Target
For more insight on analysts targets of TWOU, see our TWOU price target page. And for a list of of all stocks sorted by upside potential based on analyst target price, see our Top Price Target page.
Average Price Target | $59.00 | Average Broker Recommendation | 1.42 (Moderate Buy) |
2U, Inc. (TWOU) Company Bio
2U Inc. provides cloud-based software-as-a-service (SaaS) solutions for nonprofit colleges and universities to deliver education to qualified students. The company was founded in 2008 and is based in Landover, Maryland.
Latest TWOU News From Around the Web
Below are the latest news stories about 2U INC that investors may wish to consider to help them evaluate TWOU as an investment opportunity.
15 Countries with the Highest Salaries for TeachersIn this article, we will look at the 15 countries with the highest salaries for teachers. We have also discussed the rising concerns of teacher shortages globally. If you want to skip our detailed analysis, head straight to the 5 Countries with the Highest Salaries for Teachers. UNESCO estimated in 2016 that the world needs […] |
20 Most Advanced Countries in EducationIn this article, we will be looking at the 20 most advanced countries in education. If you want to skip our detailed analysis of the global educational services market, you can go directly to 5 Most Advanced Countries in Education. Education has become a necessary tool for personal growth and economic development, shaping lives while […] |
2U, Inc. Announces Leadership Transition2U, Inc. (Nasdaq: TWOU), a leading online education platform company, today announced a change of leadership to spearhead the next stage of its evolution as it focuses on improving operational efficiency and delivering profitable growth and cash flow. The Board of Directors has appointed Paul Lalljie, the company's current Chief Financial Officer, to succeed Christopher "Chip" Paucek as Chief Executive Officer and as a member of the Board of Directors, effective immediately. Additionally, Matt N |
Sidoti Events, LLC’s Virtual November Micro-Cap ConferenceNEW YORK, NY / ACCESSWIRE / November 14, 2023 / Sidoti Events, LLC, an affiliate of Sidoti & Company, LLC, has released the presentation schedule and weblinks for its two-day November Micro-Cap Conference taking place Wednesday and Thursday, November ... |
These Analysts Just Made A Huge Downgrade To Their 2U, Inc. (NASDAQ:TWOU) EPS ForecastsToday is shaping up negative for 2U, Inc. ( NASDAQ:TWOU ) shareholders, with the analysts delivering a substantial... |
TWOU Price Returns
1-mo | -38.34% |
3-mo | -62.58% |
6-mo | -70.47% |
1-year | -84.28% |
3-year | -96.41% |
5-year | -97.94% |
YTD | -81.02% |
2022 | -68.76% |
2021 | -49.84% |
2020 | 66.78% |
2019 | -51.75% |
2018 | -22.93% |
Continue Researching TWOU
Want to see what other sources are saying about 2U Inc's financials and stock price? Try the links below:2U Inc (TWOU) Stock Price | Nasdaq
2U Inc (TWOU) Stock Quote, History and News - Yahoo Finance
2U Inc (TWOU) Stock Price and Basic Information | MarketWatch
Loading social stream, please wait...