Unifi, Inc. New (UFI): Price and Financial Metrics
UFI Price/Volume Stats
Current price | $6.40 | 52-week high | $10.53 |
Prev. close | $6.46 | 52-week low | $5.85 |
Day low | $6.35 | Volume | 38,000 |
Day high | $6.44 | Avg. volume | 119,182 |
50-day MA | $6.62 | Dividend yield | N/A |
200-day MA | $7.58 | Market Cap | 115.95M |
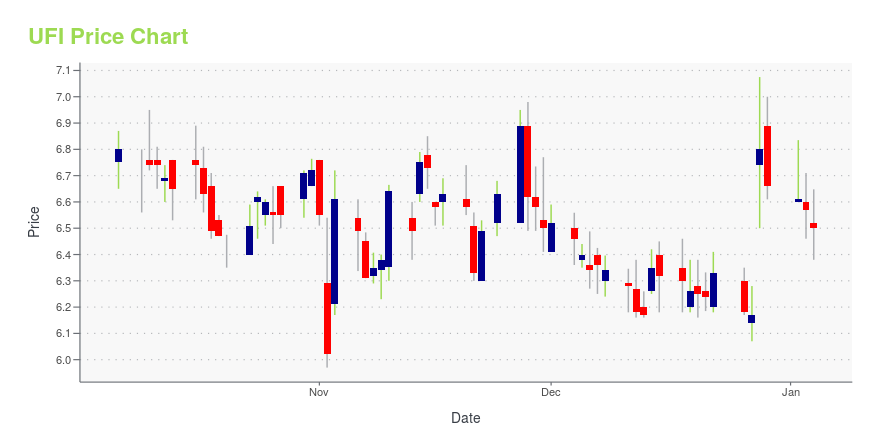
UFI Stock Price Chart Interactive Chart >
UFI POWR Grades
- Value is the dimension where UFI ranks best; there it ranks ahead of 77.21% of US stocks.
- UFI's strongest trending metric is Momentum; it's been moving up over the last 177 days.
- UFI ranks lowest in Quality; there it ranks in the 20th percentile.
UFI Stock Summary
- UFI's one year PEG ratio, measuring expected growth in earnings next year relative to current common stock price is 0.49 -- higher than just 5% of US-listed equities with positive expected earnings growth.
- UFI's price/sales ratio is 0.2; that's higher than the P/S ratio of merely 6.28% of US stocks.
- In terms of twelve month growth in earnings before interest and taxes, UNIFI INC is reporting a growth rate of -468.84%; that's higher than just 2.98% of US stocks.
- Stocks that are quantitatively similar to UFI, based on their financial statements, market capitalization, and price volatility, are THRY, ATKR, PATK, VRM, and FNKO.
- UFI's SEC filings can be seen here. And to visit UNIFI INC's official web site, go to www.unifi.com.
UFI Valuation Summary
- UFI's price/earnings ratio is -2.3; this is 114.29% lower than that of the median Consumer Cyclical stock.
- UFI's price/earnings ratio has moved up 5.3 over the prior 243 months.
Below are key valuation metrics over time for UFI.
Stock | Date | P/S | P/B | P/E | EV/EBIT |
---|---|---|---|---|---|
UFI | 2023-12-01 | 0.2 | 0.4 | -2.3 | -4.8 |
UFI | 2023-11-30 | 0.2 | 0.4 | -2.3 | -4.8 |
UFI | 2023-11-29 | 0.2 | 0.4 | -2.3 | -4.8 |
UFI | 2023-11-28 | 0.2 | 0.4 | -2.3 | -4.8 |
UFI | 2023-11-27 | 0.2 | 0.4 | -2.4 | -4.9 |
UFI | 2023-11-24 | 0.2 | 0.4 | -2.3 | -4.8 |
UFI Growth Metrics
- Its 2 year net cashflow from operations growth rate is now at -78.22%.
- Its 3 year net income to common stockholders growth rate is now at 105.39%.
- The 5 year revenue growth rate now stands at 9.39%.

The table below shows UFI's growth in key financial areas (numbers in millions of US dollars).
Date | Revenue | Operating Cash Flow | Net Income to Common Stock |
---|---|---|---|
2022-12-31 | 734.087 | 11.602 | -20.309 |
2022-09-30 | 799.285 | 10.296 | -1.343 |
2022-06-30 | 815.758 | 0.38 | 15.171 |
2022-03-31 | 782.627 | 8.908 | 25.094 |
2021-12-31 | 760.713 | 13.005 | 27.786 |
2021-09-30 | 722.079 | 12.951 | 34.321 |
UFI's Quality Factors
The “Quality” component of the POWR Ratings focuses on 31 different factors of a companies fundamentals and operational strength. Here are some key insights as we drill into the specifics of these quality attributes.- UFI has a Quality Grade of C, ranking ahead of 56.41% of graded US stocks.
- UFI's asset turnover comes in at 1.346 -- ranking 3rd of 7 Textiles stocks.
- CRWS, CULP, and MHK are the stocks whose asset turnover ratios are most correlated with UFI.
The table below shows UFI's key quality metrics over time.
Period | Asset Turnover | Gross Margin | ROIC |
---|---|---|---|
2021-09-26 | 1.346 | 0.145 | 0.130 |
2021-06-27 | 1.278 | 0.140 | 0.110 |
2021-03-28 | 1.134 | 0.100 | 0.011 |
2020-12-27 | 1.110 | 0.083 | -0.089 |
2020-09-27 | 1.080 | 0.064 | -0.104 |
2020-06-28 | 1.101 | 0.064 | -0.091 |
UFI Price Target
For more insight on analysts targets of UFI, see our UFI price target page. And for a list of of all stocks sorted by upside potential based on analyst target price, see our Top Price Target page.
Average Price Target | $36.67 | Average Broker Recommendation | 1.33 (Strong Buy) |
Unifi, Inc. New (UFI) Company Bio
Unifi Inc. manufactures and sells polyester and nylon yarn products in the United States and internationally. It operates through three segments: Polyester, Nylon, and International. The company was founded in 1969 and is based in Greensboro, North Carolina.
Latest UFI News From Around the Web
Below are the latest news stories about UNIFI INC that investors may wish to consider to help them evaluate UFI as an investment opportunity.
Unifi, Inc. (NYSE:UFI) is definitely on the radar of institutional investors who own 50% of the companyKey Insights Given the large stake in the stock by institutions, Unifi's stock price might be vulnerable to their... |
Unifi, Inc. (NYSE:UFI) Q1 2024 Earnings Call TranscriptUnifi, Inc. (NYSE:UFI) Q1 2024 Earnings Call Transcript November 4, 2023 A.J. Eaker: Good morning, everyone. Thank you for attending Unifi’s First Quarter Fiscal 2024 Earnings Conference Call. We do apologize for the technical difficulties and the late start, but we will be quick and I hope to answer your questions as quickly as possible. […] |
Q1 2024 Unifi Inc Earnings CallQ1 2024 Unifi Inc Earnings Call |
Unifi Inc (UFI) Reports Q1 Fiscal 2024 Results: Net Sales Down by 22.7%Despite a decrease in net sales, Unifi Inc (UFI) managed to reduce net debt through disciplined cost control measures and reduced capital expenditures |
UNIFI®, Makers of REPREVE®, Announces First Quarter Fiscal 2024 ResultsGREENSBORO, N.C., November 01, 2023--Unifi, Inc. (NYSE: UFI) (together with its consolidated subsidiaries, "UNIFI"), makers of REPREVE and one of the world’s leading innovators in recycled and synthetic yarns, today released operating results for the first fiscal quarter ended October 1, 2023. |
UFI Price Returns
1-mo | -1.39% |
3-mo | -7.51% |
6-mo | -15.57% |
1-year | -24.88% |
3-year | -61.17% |
5-year | -74.18% |
YTD | -25.67% |
2022 | -62.81% |
2021 | 30.50% |
2020 | -29.77% |
2019 | 10.60% |
2018 | -36.33% |
Continue Researching UFI
Here are a few links from around the web to help you further your research on Unifi Inc's stock as an investment opportunity:Unifi Inc (UFI) Stock Price | Nasdaq
Unifi Inc (UFI) Stock Quote, History and News - Yahoo Finance
Unifi Inc (UFI) Stock Price and Basic Information | MarketWatch
Loading social stream, please wait...