
Veracyte, Inc. (VCYT): Price and Financial Metrics
VCYT Price/Volume Stats
| Current price | $19.20 | 52-week high | $30.52 |
| Prev. close | $18.86 | 52-week low | $18.61 |
| Day low | $18.61 | Volume | 813,915 |
| Day high | $19.35 | Avg. volume | 629,407 |
| 50-day MA | $22.32 | Dividend yield | N/A |
| 200-day MA | $24.44 | Market Cap | 1.44B |
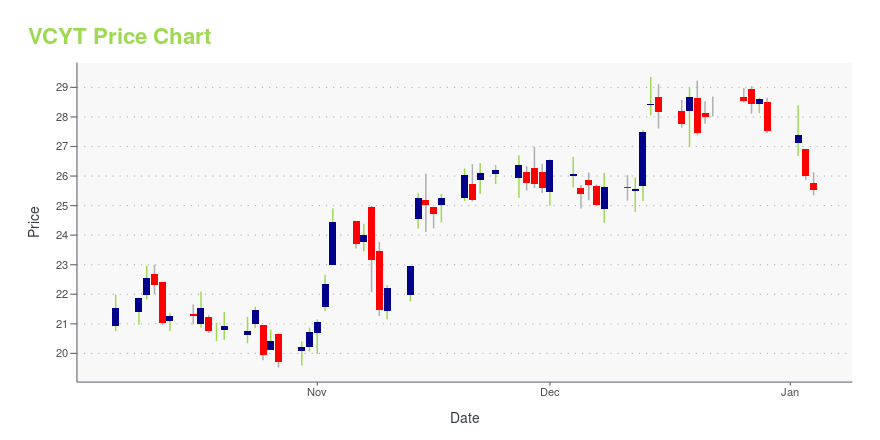
VCYT Stock Price Chart Interactive Chart >
Veracyte, Inc. (VCYT) Company Bio
Veracyte Inc. operates as a molecular diagnostics company in the United States. It operates in the field of molecular cytology with genomic solutions that resolve diagnostic ambiguity and enable physicians to make informed treatment decisions at an early stage in patient care. The company was founded in 2006 and is based in San Francisco, California.
Latest VCYT News From Around the Web
Below are the latest news stories about VERACYTE INC that investors may wish to consider to help them evaluate VCYT as an investment opportunity.
Veracyte to Participate in the 42nd Annual J.P. Morgan Healthcare ConferenceSOUTH SAN FRANCISCO, Calif., December 12, 2023--Veracyte, Inc. (Nasdaq: VCYT) announced today that Marc Stapley, chief executive officer, and Rebecca Chambers, chief financial officer, will present at the 42nd annual J.P. Morgan Healthcare Conference on Monday, January 8, 2024, at 1:30 p.m. Pacific Time. |
Real-World Data Presented at SUO 2023 Show that Veracyte’s Decipher Genomic Classifier Identifies Patients Whose Prostate Cancer is Likely to ProgressSOUTH SAN FRANCISCO, Calif., December 01, 2023--Veracyte, Inc. (Nasdaq: VCYT) announced that new data presented today at the 24th Annual Meeting of the Society of Urologic Oncology (SUO 2023) highlight clinical observations and translational research conducted by users of the company’s Decipher Prostate Genomic Classifier. These independent, real-world studies provide further evidence supporting the clinical utility of the test in the treatment and management of prostate cancer, particularly for |
Clinical Validation Data Published in CHEST Demonstrate that Veracyte’s Percepta Nasal Swab Test Improves Lung Cancer Risk Assessment for Patients with Lung NodulesSOUTH SAN FRANCISCO, Calif., November 29, 2023--Clinical Validation Data for Veracyte's Percepta Nasal Swab Test Published in CHEST |
Veracyte Announces Seven Posters Highlighting Clinical Value of Decipher Prostate Genomic Testing To be Presented at SUO 2023SOUTH SAN FRANCISCO, Calif., November 22, 2023--Veracyte, Inc. (Nasdaq: VCYT) today announced that seven posters will be presented at the 24th Annual Meeting of the Society of Urologic Oncology (SUO 2023), where they will demonstrate the clinical performance of Veracyte’s Decipher Prostate Genomic Classifier in identifying patients whose prostate cancer is likely to progress and require treatment. Collectively, the posters will report data from more than 60,000 patients. The meeting will take pl |
Veracyte, Inc. (NASDAQ:VCYT) Q3 2023 Earnings Call TranscriptVeracyte, Inc. (NASDAQ:VCYT) Q3 2023 Earnings Call Transcript November 7, 2023 Veracyte, Inc. misses on earnings expectations. Reported EPS is $-0.41 EPS, expectations were $-0.16. Operator: Good day, and thank you for standing by. Welcome to the Veracyte Third Quarter 2023 Financial Results Webcast. At this time all participants are in a listen-only mode. [Operator […] |
VCYT Price Returns
| 1-mo | -11.40% |
| 3-mo | -24.79% |
| 6-mo | -8.27% |
| 1-year | -17.28% |
| 3-year | -57.63% |
| 5-year | -16.63% |
| YTD | -30.21% |
| 2023 | 15.93% |
| 2022 | -42.40% |
| 2021 | -15.82% |
| 2020 | 75.29% |
| 2019 | 121.94% |
Continue Researching VCYT
Want to see what other sources are saying about Veracyte Inc's financials and stock price? Try the links below:Veracyte Inc (VCYT) Stock Price | Nasdaq
Veracyte Inc (VCYT) Stock Quote, History and News - Yahoo Finance
Veracyte Inc (VCYT) Stock Price and Basic Information | MarketWatch
Loading social stream, please wait...