Village Super Market, Inc. - (VLGEA): Price and Financial Metrics

Village Super Market, Inc. - (VLGEA): $20.76

0.21 (+1.02%)

POWR Rating

Component Grades

Momentum

F

Stability

A

Sentiment

Quality

B

Add VLGEA to Watchlist
Sign Up

Industry: Grocery/Big Box Retailers

Industry

A

Ranked

#1 of 37

in industry

VLGEA Price/Volume Stats

Current price $20.76 52-week high $24.43
Prev. close $20.55 52-week low $19.09
Day low $20.59 Volume 15,600
Day high $20.98 Avg. volume 22,295
50-day MA $21.77 Dividend yield 4.75%
200-day MA $22.18 Market Cap 301.25M

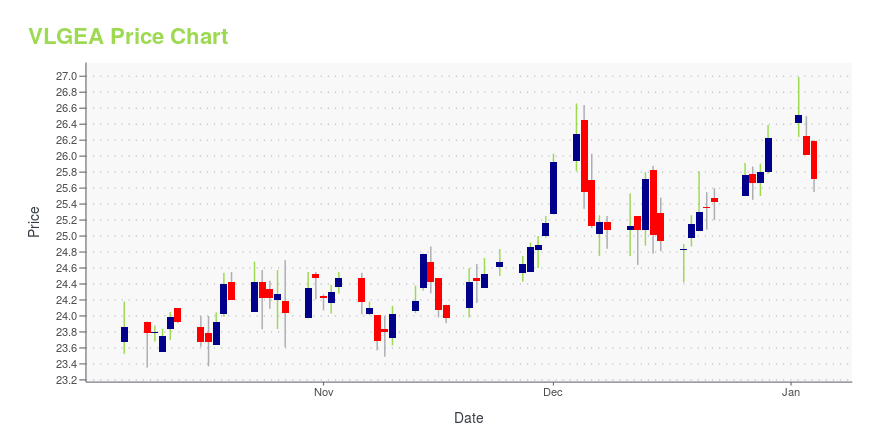
VLGEA Stock Price Chart Interactive Chart >

VLGEA POWR Grades

  • VLGEA scores best on the Stability dimension, with a Stability rank ahead of 98.99% of US stocks.
  • VLGEA's strongest trending metric is Momentum; it's been moving down over the last 179 days.
  • VLGEA ranks lowest in Momentum; there it ranks in the 1st percentile.

VLGEA Stock Summary

  • The capital turnover (annual revenue relative to shareholder's equity) for VLGEA is 5.4 -- better than 91.68% of US stocks.
  • VLGEA's price/sales ratio is 0.14; that's higher than the P/S ratio of just 3.9% of US stocks.
  • In terms of volatility of its share price, VLGEA is more volatile than merely 3.12% of stocks we're observing.
  • Stocks that are quantitatively similar to VLGEA, based on their financial statements, market capitalization, and price volatility, are ZEUS, TCS, IPW, IDT, and ELA.
  • Visit VLGEA's SEC page to see the company's official filings. To visit the company's web site, go to myvillagesupermarket.com.

VLGEA Valuation Summary

  • VLGEA's price/earnings ratio is 9.3; this is 56.64% lower than that of the median Consumer Defensive stock.
  • VLGEA's price/sales ratio has moved down 0 over the prior 243 months.

Below are key valuation metrics over time for VLGEA.

Stock Date P/S P/B P/E EV/EBIT
VLGEA 2023-05-23 0.1 0.8 9.3 11.3
VLGEA 2023-05-22 0.1 0.8 9.3 11.3
VLGEA 2023-05-19 0.1 0.8 9.2 11.2
VLGEA 2023-05-18 0.1 0.8 9.3 11.3
VLGEA 2023-05-17 0.1 0.8 9.4 11.3
VLGEA 2023-05-16 0.1 0.8 9.2 11.2

VLGEA Growth Metrics

    Its 4 year cash and equivalents growth rate is now at 11.23%.
  • Its 2 year revenue growth rate is now at 20.24%.
  • Its 2 year net income to common stockholders growth rate is now at 5.69%.
VLGEA's revenue has moved up $459,471,000 over the prior 49 months.

The table below shows VLGEA's growth in key financial areas (numbers in millions of US dollars).

Date Revenue Operating Cash Flow Net Income to Common Stock
2022-09-30 2,086.562 93.757 30.582
2022-06-30 2,061.084 79.625 26.83
2022-03-31 2,069.864 71.399 23.73
2021-12-31 2,048.995 68.055 29.535
2021-09-30 2,034.405 63.932 23.961
2021-06-30 2,030.33 52.692 19.994

VLGEA's Quality Factors

The “Quality” component of the POWR Ratings focuses on 31 different factors of a companies fundamentals and operational strength. Here are some key insights as we drill into the specifics of these quality attributes.
  • VLGEA has a Quality Grade of B, ranking ahead of 76.78% of graded US stocks.
  • VLGEA's asset turnover comes in at 2.264 -- ranking 31st of 165 Retail stocks.
  • KSPN, NUZE, and FCFS are the stocks whose asset turnover ratios are most correlated with VLGEA.

The table below shows VLGEA's key quality metrics over time.

Period Asset Turnover Gross Margin ROIC
2021-07-31 2.264 0.278 0.032
2021-04-24 2.209 0.280 0.028
2021-01-23 2.382 0.281 0.044
2020-10-24 2.521 0.281 0.046
2020-07-25 2.699 0.281 0.054
2020-04-25 3.046 0.277 0.073

Village Super Market, Inc. - (VLGEA) Company Bio


Village Super Market operates a chain of supermarkets in the United States. primarily in the northeast. The company was founded in 1933 and is based in Springfield, New Jersey.


VLGEA Latest News Stream


Event/Time News Detail
Loading, please wait...

VLGEA Latest Social Stream


Loading social stream, please wait...

View Full VLGEA Social Stream

Latest VLGEA News From Around the Web

Below are the latest news stories about VILLAGE SUPER MARKET INC that investors may wish to consider to help them evaluate VLGEA as an investment opportunity.

7 Consumer Stocks to Watch as the Economy Rebounds

With a myriad of events weighing down the market, concerned investors should seek in these attractive consumer staples stocks to buy

Muslim Farooque on InvestorPlace | May 1, 2023

Village Super Market, Inc. (NASDAQ:VLGE.A) is definitely on the radar of institutional investors who own 43% of the company

Key Insights Given the large stake in the stock by institutions, Village Super Market's stock price might be vulnerable...

Yahoo | April 19, 2023

7 Consumer Staples Stocks to Buy for Reliable Dividends

With myriad events spooking the market, concerned investors should seek shelter in these consumer staples stocks to buy.

Josh Enomoto on InvestorPlace | March 30, 2023

Village Super Market, Inc. Declares Quarterly Dividend

SPRINGFIELD, N.J., March 23, 2023 (GLOBE NEWSWIRE) -- The Board of Directors of Village Super Market, Inc. (NSD-VLGEA) declared quarterly cash dividends of $0.25 per Class A common share and $0.1625 per Class B common share. The dividends will be payable on April 27, 2023 to shareholders of record at the close of business on April 6, 2023. Village Super Market operates a chain of 34 supermarkets under the ShopRite and Fairway names in New Jersey, Maryland, New York and eastern Pennsylvania and f

Yahoo | March 23, 2023

Village Super Market (NASDAQ:VLGE.A) Is Paying Out A Dividend Of $0.25

Village Super Market, Inc. ( NASDAQ:VLGE.A ) will pay a dividend of $0.25 on the 27th of April. The dividend yield will...

Yahoo | March 23, 2023

Read More 'VLGEA' Stories Here

VLGEA Price Returns

1-mo -4.33%
3-mo -6.91%
6-mo -7.35%
1-year -8.49%
3-year -1.34%
5-year -12.46%
YTD -8.90%
2022 4.11%
2021 9.46%
2020 -0.96%
2019 -8.94%
2018 21.18%

VLGEA Dividends

Ex-Dividend Date Type Payout Amount Change
Loading, please wait...
View Full VLGEA Dividend History

Get Free Updates

Join thousands of investors who get the latest news, insights and top rated picks from StockNews.com!