
Vontier Corporation (VNT): Price and Financial Metrics
VNT Price/Volume Stats
| Current price | $39.96 | 52-week high | $45.62 |
| Prev. close | $40.33 | 52-week low | $26.23 |
| Day low | $39.79 | Volume | 617,800 |
| Day high | $40.71 | Avg. volume | 780,979 |
| 50-day MA | $42.19 | Dividend yield | 0.25% |
| 200-day MA | $34.70 | Market Cap | 6.18B |
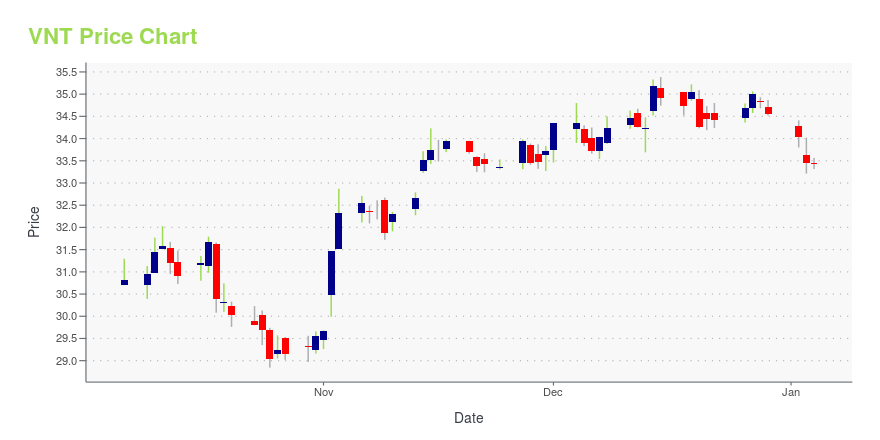
VNT Stock Price Chart Interactive Chart >
Vontier Corporation (VNT) Company Bio
Vontier Corporation operates as an industrial technology company. The Company offers environmental sensors, fueling equipment, field payment hardware, remote management and workflow software, vehicle tracking, and fleet management software solutions. Vontier serves customers worldwide.
Latest VNT News From Around the Web
Below are the latest news stories about VONTIER CORP that investors may wish to consider to help them evaluate VNT as an investment opportunity.
Vontier Appoints Mike Dwyer as President of Matco ToolsRALEIGH, N.C., December 12, 2023--Vontier Corporation (NYSE: VNT), a leading global provider of critical technologies and solutions to connect, manage, and scale the mobility ecosystem, today announced the appointment of Mike Dwyer as President, Matco Tools effective immediately. Mr. Dwyer succeeds Tim Gilmore, who will retire from the company following an exceptional 36-year career with the organization. Gilmore will serve in an advisory capacity to ensure a smooth and seamless transition. |
Vontier Named to Newsweek’s Most Responsible Companies 2024 ListRALEIGH, N.C., December 06, 2023--Vontier Corporation (NYSE: VNT), a leading global provider of critical technologies and solutions to connect, manage, and scale the mobility ecosystem, has been named to Newsweek’s list of America’s Most Responsible Companies 2024. This prestigious award is presented by Newsweek and Statista Inc., the world-leading statistics portal and industry ranking provider. |
3 Post-Black Friday Stocks to Buy for Big GainsInvestors wanting big gains should consider these companies, each of which has a stock that has outperformed the market over the last year. |
CORRECTING and REPLACING Vontier Declares Regular DividendRALEIGH, N.C., November 13, 2023--Vontier Declares Regular Dividend |
Vontier Reports Strong Third Quarter Results and Raises 2023 Adjusted EPS MidpointRALEIGH, N.C., November 02, 2023--Vontier Reports Strong Third Quarter Results and Raises 2023 Adjusted EPS Midpoint |
VNT Price Returns
| 1-mo | -11.20% |
| 3-mo | 13.20% |
| 6-mo | 34.23% |
| 1-year | 46.22% |
| 3-year | 31.97% |
| 5-year | N/A |
| YTD | 15.73% |
| 2023 | 79.34% |
| 2022 | -36.82% |
| 2021 | -7.79% |
| 2020 | N/A |
| 2019 | N/A |
VNT Dividends
| Ex-Dividend Date | Type | Payout Amount | Change | ||||||
|---|---|---|---|---|---|---|---|---|---|
| Loading, please wait... | |||||||||
Loading social stream, please wait...