
VivoPower International PLC (VVPR): Price and Financial Metrics
VVPR Price/Volume Stats
| Current price | $3.60 | 52-week high | $9.90 |
| Prev. close | $3.54 | 52-week low | $1.02 |
| Day low | $3.47 | Volume | 111,000 |
| Day high | $3.75 | Avg. volume | 2,351,617 |
| 50-day MA | $2.49 | Dividend yield | N/A |
| 200-day MA | $2.97 | Market Cap | 9.46M |
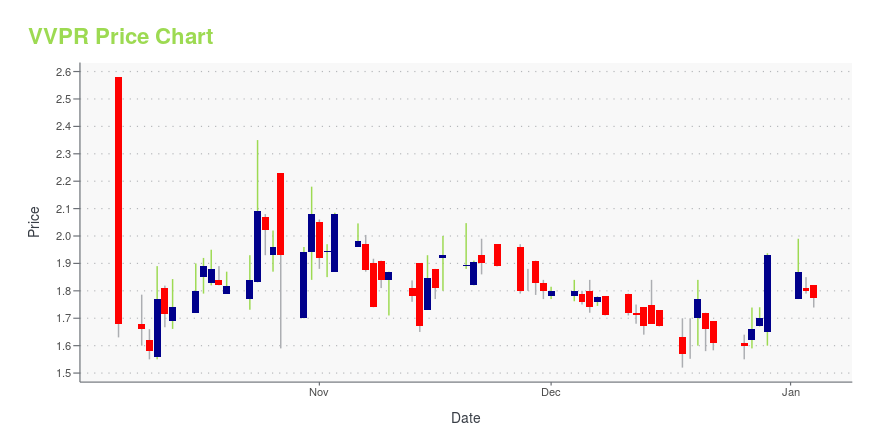
VVPR Stock Price Chart Interactive Chart >
VivoPower International PLC (VVPR) Company Bio
VivoPower International Plc engages in the development, procurement, and construction of small and medium scale solar and selected solar asset ownership and maintenance. It operates through the following segments: Critical Power Services, Solar Development, and Corporate Office. The Critical Power Services segment focuses on the design, supply, installation, and maintenance of power and control systems. The Solar Development segment involves development and sale of commercial and utility scale photovoltaic solar power projects. The Corporate Office segment includes the firm's administrative operations. The company was founded by Tser Fah Chin on February 1, 2016 and is headquartered in London, the United Kingdom.
Latest VVPR News From Around the Web
Below are the latest news stories about VIVOPOWER INTERNATIONAL PLC that investors may wish to consider to help them evaluate VVPR as an investment opportunity.
VIVOPOWER ANNOUNCES “SUM OF THE PARTS” STRATEGIC VALUE MAXIMISATION REVIEWBoard initiated review following inbound M&A expressions of interest Non binding letters of intent received for Tembo and Aevitas Kenshaw LONDON, Nov. 14, 2023 (GLOBE NEWSWIRE) -- VivoPower International PLC (NASDAQ: VVPR, “VivoPower”, the “Company”) has announced today that it has initiated a sum of the parts strategic value maximisation review in relation to the Company and has engaged a corporate adviser, Chardan, in this regard. The strategic review has been prompted by inbound expressions o |
VIVOPOWER BOARD ESTABLISHES ILLEGAL MARKET MANIPULATION TASK FORCELONDON, Oct. 31, 2023 (GLOBE NEWSWIRE) -- VivoPower International PLC (NASDAQ: VVPR, “VivoPower”, the “Company”) has approved an action plan to address alleged illegal market manipulation including dissemination of false information and/or naked short selling of its stock. This action plan includes creating a Board-led ‘Illegal Market Manipulation Task Force’ to actively pursue all possible actions together with the regulators in their discovery and prosecution of persons engaging in market mani |
Today’s Biggest Pre-Market Stock Movers: 10 Top Gainers and Losers on MondayIt's time to dive into the biggest pre-market stock movers as we start the trading week on Monday with the hottest coverage! |
VIVOPOWER ANNOUNCES PLANS TO SPIN OFF MAJORITY OF CARET BUSINESS UNIT PORTFOLIO AND DISTRIBUTION OF SPECIAL DIVIDEND STOCKLONDON, Oct. 27, 2023 (GLOBE NEWSWIRE) -- VivoPower International PLC (NASDAQ: VVPR, “VivoPower”, the “Company”) announced today that its board of directors has approved an execution plan to spin off the majority of its Caret business unit’s portfolio, representing up to ten solar projects totalling 586MW-DC at varying stages of development. This does not include the two solar projects (totalling 96.5MW-DC) that were committed to a joint venture valued at $7.7m (representing a valuation of $80,0 |
VIVOPOWER SIGNS DEFINITIVE JOINT VENTURE AGREEMENT WITH DIGITAL TWIN TECHNOLOGY COMPANY, GEMINUMVivoPower and Geminum team up to offer holistic end-to-end fleet electrification and decarbonisation solutions Geminum specialises in digital twin solutions for corporations seeking to implement decarbonisation solutions in a safe, cost-effective and integrated manner Geminum leadership team have 20 years of combined digital twin and change management experience, particularly in the mining industry LONDON, Oct. 18, 2023 (GLOBE NEWSWIRE) -- NASDAQ listed B Corp, VivoPower International PLC (“Vivo |
VVPR Price Returns
| 1-mo | 146.58% |
| 3-mo | 183.46% |
| 6-mo | 86.53% |
| 1-year | 0.98% |
| 3-year | -95.84% |
| 5-year | -72.93% |
| YTD | 86.54% |
| 2023 | -21.64% |
| 2022 | -91.92% |
| 2021 | -67.13% |
| 2020 | 783.81% |
| 2019 | 62.79% |
Loading social stream, please wait...