WEX Inc. common stock (WEX): Price and Financial Metrics
GET POWR RATINGS... FREE!
WEX POWR Grades
- WEX scores best on the Growth dimension, with a Growth rank ahead of 97.64% of US stocks.
- The strongest trend for WEX is in Growth, which has been heading up over the past 177 days.
- WEX ranks lowest in Value; there it ranks in the 18th percentile.
WEX Stock Summary
- WEX's current price/earnings ratio is 78.57, which is higher than 93.32% of US stocks with positive earnings.
- In terms of twelve month growth in earnings before interest and taxes, WEX INC is reporting a growth rate of 2,536.82%; that's higher than 99.23% of US stocks.
- The volatility of WEX INC's share price is greater than that of just 15.69% US stocks with at least 200 days of trading history.
- Stocks that are quantitatively similar to WEX, based on their financial statements, market capitalization, and price volatility, are PX, WHG, MORN, MAXR, and ENSG.
- WEX's SEC filings can be seen here. And to visit WEX INC's official web site, go to www.wexinc.com.
WEX Valuation Summary
- WEX's price/earnings ratio is 78; this is 205.88% higher than that of the median Technology stock.
- WEX's price/earnings ratio has moved up 64.6 over the prior 218 months.
Below are key valuation metrics over time for WEX.
Stock | Date | P/S | P/B | P/E | EV/EBIT |
---|---|---|---|---|---|
WEX | 2023-01-25 | 3.5 | 4.8 | 78.0 | 24.7 |
WEX | 2023-01-24 | 3.5 | 4.8 | 78.2 | 24.7 |
WEX | 2023-01-23 | 3.5 | 4.8 | 77.9 | 24.6 |
WEX | 2023-01-20 | 3.5 | 4.7 | 76.4 | 24.2 |
WEX | 2023-01-19 | 3.4 | 4.7 | 75.5 | 24.0 |
WEX | 2023-01-18 | 3.4 | 4.7 | 75.5 | 24.0 |
WEX Growth Metrics
- The 5 year net cashflow from operations growth rate now stands at 414.53%.
- The 3 year revenue growth rate now stands at 28.8%.
- Its 4 year price growth rate is now at 32.57%.

The table below shows WEX's growth in key financial areas (numbers in millions of US dollars).
Date | Revenue | Operating Cash Flow | Net Income to Common Stock |
---|---|---|---|
2022-09-30 | 2,229.439 | 617.397 | 100.987 |
2022-06-30 | 2,096.074 | 134.215 | 193.45 |
2022-03-31 | 1,957.32 | 206.663 | 125.465 |
2021-12-31 | 1,850.542 | 150.398 | 0.137 |
2021-09-30 | 1,751.994 | 72.208 | -222.303 |
2021-06-30 | 1,651.346 | 9.091 | -336.461 |
WEX's Quality Factors
The “Quality” component of the POWR Ratings focuses on 31 different factors of a companies fundamentals and operational strength. Here are some key insights as we drill into the specifics of these quality attributes.- WEX has a Quality Grade of C, ranking ahead of 25.83% of graded US stocks.
- WEX's asset turnover comes in at 0.194 -- ranking 490th of 561 Business Services stocks.
- LTRPA, G, and CELP are the stocks whose asset turnover ratios are most correlated with WEX.
The table below shows WEX's key quality metrics over time.
Period | Asset Turnover | Gross Margin | ROIC |
---|---|---|---|
2021-06-30 | 0.194 | 0.603 | -0.029 |
2021-03-31 | 0.188 | 0.581 | -0.037 |
2020-12-31 | 0.194 | 0.568 | -0.050 |
2020-09-30 | 0.199 | 0.572 | 0.054 |
2020-06-30 | 0.207 | 0.587 | 0.081 |
2020-03-31 | 0.214 | 0.610 | 0.092 |
WEX Price Target
For more insight on analysts targets of WEX, see our WEX price target page. And for a list of of all stocks sorted by upside potential based on analyst target price, see our Top Price Target page.
Average Price Target | $227.33 | Average Broker Recommendation | 1.68 (Moderate Buy) |
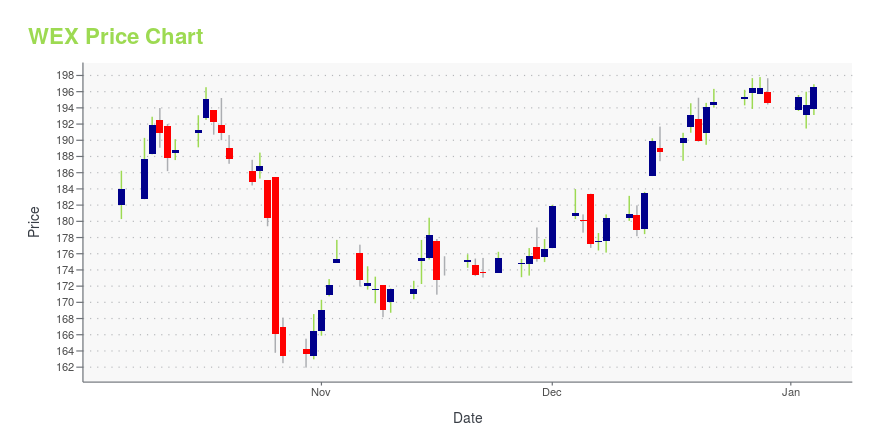
WEX Stock Price Chart Interactive Chart >
WEX Price/Volume Stats
Current price | $181.87 | 52-week high | $183.70 |
Prev. close | $182.01 | 52-week low | $125.00 |
Day low | $180.70 | Volume | 146,100 |
Day high | $183.70 | Avg. volume | 292,122 |
50-day MA | $166.67 | Dividend yield | N/A |
200-day MA | $159.80 | Market Cap | 7.93B |
WEX Inc. common stock (WEX) Company Bio
WEX Inc. provides corporate card payment solutions in North and South America, the Asia Pacific, and Europe. The company was founded in 1983 and is based in South Portland, Maine.
Latest WEX News From Around the Web
Below are the latest news stories about WEX INC that investors may wish to consider to help them evaluate WEX as an investment opportunity.
2 Stocks to Benefit From Falling InflationAmazon and WEX are poised to benefit from the latest inflation report |
Here's Why You Should Retain WEX Stock in Your PortfolioProduct and service quality and a deep understanding of customers' operational needs provide revenue stability to WEX. |
Are You a Value Investor? This 1 Stock Could Be the Perfect PickThe Zacks Style Scores offers investors a way to easily find top-rated stocks based on their investing style. Here's why you should take advantage. |
Have you been able to find a good deal on WEX Inc.’s shares?As of Friday, WEX Inc.’s (NYSE:WEX) stock closed at $163.65, up from $163.42 the previous day. While WEX Inc. has overperformed by 0.14%, investors are advised to look at stock chart patterns for technical insight. Within its last year performance, WEX rose by 15.70%, with highs and lows ranging from $183.38 to $125.00, whereas the […] |
WEX Inc. (WEX) is an excellent investment, but the stock is overvalued/undervalued right nowWEX Inc. (NYSE:WEX) marked $161.90 per share on Friday, up from a previous closing price of $158.86. While WEX Inc. has overperformed by 1.91%, investors are advised to look at stock chart patterns for technical insight. Within its last year performance, WEX rose by 17.64%, with highs and lows ranging from $183.38 to $125.00, whereas […] |
WEX Price Returns
1-mo | 11.29% |
3-mo | 11.71% |
6-mo | 9.42% |
1-year | 16.57% |
3-year | -19.75% |
5-year | 16.58% |
YTD | 11.13% |
2022 | 16.57% |
2021 | -31.02% |
2020 | -2.83% |
2019 | 49.55% |
2018 | -0.83% |
Continue Researching WEX
Want to see what other sources are saying about WEX Inc's financials and stock price? Try the links below:WEX Inc (WEX) Stock Price | Nasdaq
WEX Inc (WEX) Stock Quote, History and News - Yahoo Finance
WEX Inc (WEX) Stock Price and Basic Information | MarketWatch
Loading social stream, please wait...