Worthington Industries, Inc. (WOR): Price and Financial Metrics

Worthington Industries, Inc. (WOR): $61.29

0.51 (+0.84%)

POWR Rating

Component Grades

Momentum

B

Stability

C

Sentiment

Quality

B

Add WOR to Watchlist
Sign Up

Industry: Steel

Industry

A

Ranked

#8 of 32

in industry

WOR Price/Volume Stats
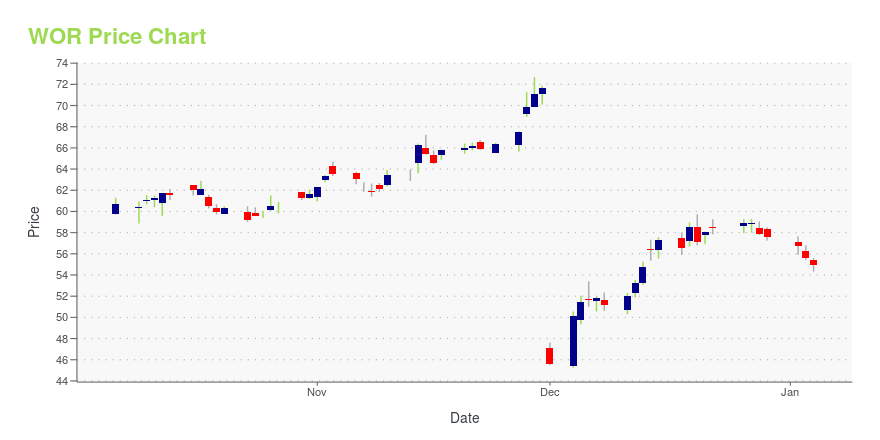
Current price $61.29 52-week high $77.42
Prev. close $60.78 52-week low $41.61
Day low $60.49 Volume 49,106
Day high $61.49 Avg. volume 186,115
50-day MA $70.94 Dividend yield 2.07%
200-day MA $62.30 Market Cap 3.06B

WOR Stock Price Chart Interactive Chart >

WOR POWR Grades

  • Sentiment is the dimension where WOR ranks best; there it ranks ahead of 88.15% of US stocks.
  • WOR's strongest trending metric is Quality; it's been moving up over the last 177 days.
  • WOR's current lowest rank is in the Value metric (where it is better than 54.24% of US stocks).

WOR Stock Summary

  • WORTHINGTON INDUSTRIES INC's capital turnover -- a measure of revenue relative to shareholder's equity -- is better than 81.3% of US listed stocks.
  • WORTHINGTON INDUSTRIES INC's stock had its IPO on March 26, 1990, making it an older stock than 85.48% of US equities in our set.
  • Of note is the ratio of WORTHINGTON INDUSTRIES INC's sales and general administrative expense to its total operating expenses; 79.81% of US stocks have a lower such ratio.
  • Stocks that are quantitatively similar to WOR, based on their financial statements, market capitalization, and price volatility, are ASGN, KMT, ENS, OSK, and CHX.
  • WOR's SEC filings can be seen here. And to visit WORTHINGTON INDUSTRIES INC's official web site, go to www.worthingtonindustries.com.

WOR Valuation Summary

  • In comparison to the median Industrials stock, WOR's price/earnings ratio is 27.96% lower, now standing at 13.4.
  • Over the past 243 months, WOR's price/sales ratio has gone up 0.2.

Below are key valuation metrics over time for WOR.

Stock Date P/S P/B P/E EV/EBIT
WOR 2023-09-19 0.7 2.0 13.4 10.5
WOR 2023-09-18 0.7 2.0 13.4 10.5
WOR 2023-09-15 0.7 2.0 13.3 10.5
WOR 2023-09-14 0.7 2.1 13.7 10.7
WOR 2023-09-13 0.7 2.1 13.6 10.6
WOR 2023-09-12 0.7 2.1 14.0 10.9

WOR Growth Metrics

    Its year over year net income to common stockholders growth rate is now at -34.12%.
  • The 2 year cash and equivalents growth rate now stands at -57.15%.
  • Its 5 year revenue growth rate is now at 17.44%.
WOR's revenue has moved up $1,761,256,000 over the prior 52 months.

The table below shows WOR's growth in key financial areas (numbers in millions of US dollars).

Date Revenue Operating Cash Flow Net Income to Common Stock
2022-12-31 5,482.746 453.007 216.894
2022-09-30 5,540.066 200.962 310.977
2022-06-30 5,242.219 70.112 379.386
2022-03-31 4,700.233 -54.419 412.689
2021-12-31 4,081.107 -119.353 423.956
2021-09-30 3,579.338 107.179 239.611

WOR's Quality Factors

The “Quality” component of the POWR Ratings focuses on 31 different factors of a companies fundamentals and operational strength. Here are some key insights as we drill into the specifics of these quality attributes.
  • WOR has a Quality Grade of C, ranking ahead of 61.56% of graded US stocks.
  • WOR's asset turnover comes in at 1.001 -- ranking 19th of 40 Steel Works Etc stocks.
  • SPLP, CRS, and MATW are the stocks whose asset turnover ratios are most correlated with WOR.

The table below shows WOR's key quality metrics over time.

Period Asset Turnover Gross Margin ROIC
2021-05-31 1.001 0.202 0.450
2021-02-28 0.965 0.179 0.396
2020-11-30 1.029 0.162 0.367
2020-08-31 1.129 0.151 0.442
2020-05-31 1.281 0.145 0.066
2020-02-29 1.392 0.142 0.080

WOR Price Target

For more insight on analysts targets of WOR, see our WOR price target page. And for a list of of all stocks sorted by upside potential based on analyst target price, see our Top Price Target page.

Average Price Target $68.00 Average Broker Recommendation 2 (Hold)

Worthington Industries, Inc. (WOR) Company Bio


Worthington Industries focuses on value-added steel processing and manufactured metal products in the United States, Europe, Mexico, Canada, and internationally. It operates through three segments: Steel Processing, Pressure Cylinders, and Engineered Cabs. The company was founded in 1955 and is based in Columbus, Ohio.


WOR Latest News Stream


Event/Time News Detail
Loading, please wait...

WOR Latest Social Stream


Loading social stream, please wait...

View Full WOR Social Stream

Latest WOR News From Around the Web

Below are the latest news stories about WORTHINGTON INDUSTRIES INC that investors may wish to consider to help them evaluate WOR as an investment opportunity.

3 High Dividend Stocks From The Basic Materials Sector

The prospects of three materials stocks that offer above-average dividend yields.

TalkMarkets.com | September 29, 2023

Worthington Industries, Inc.'s (NYSE:WOR) Intrinsic Value Is Potentially 76% Above Its Share Price

Key Insights Using the 2 Stage Free Cash Flow to Equity, Worthington Industries fair value estimate is US$108...

Yahoo | September 29, 2023

Q1 2024 Worthington Industries Inc Earnings Call

Q1 2024 Worthington Industries Inc Earnings Call

Yahoo | September 29, 2023

Why Worthington Industries Stock Was Falling Today

Shares of Worthington Industries (NYSE: WOR) were tumbling today after the industrial manufacturing company posted disappointing top-line results in its fiscal first-quarter earnings report. Worthington, which is a steel processor and manufacturer of pressure cylinders for products like propane, among other product lines, said that revenue fell 15% in the quarter to $1.19 billion, missing estimates at $1.23 billion. The company said lower average selling prices in steel processing as well as lower overall volumes were responsible for the decline in revenue.

Yahoo | September 28, 2023

Unveiling Worthington Industries (WOR)'s Value: Is It Really Priced Right? A Comprehensive Guide

A deep dive into the intrinsic value of Worthington Industries (WOR) with a focus on its financial strength, profitability, and growth.

Yahoo | September 28, 2023

Read More 'WOR' Stories Here

WOR Price Returns

1-mo N/A
3-mo -9.05%
6-mo N/A
1-year 38.77%
3-year 49.15%
5-year 62.71%
YTD 25.18%
2022 -6.90%
2021 8.43%
2020 25.21%
2019 24.08%
2018 -19.30%

WOR Dividends

Ex-Dividend Date Type Payout Amount Change
Loading, please wait...
View Full WOR Dividend History

Continue Researching WOR

Want to see what other sources are saying about Worthington Industries Inc's financials and stock price? Try the links below:

Worthington Industries Inc (WOR) Stock Price | Nasdaq
Worthington Industries Inc (WOR) Stock Quote, History and News - Yahoo Finance
Worthington Industries Inc (WOR) Stock Price and Basic Information | MarketWatch

Get Free Updates

Join thousands of investors who get the latest news, insights and top rated picks from StockNews.com!