
Whitestone REIT Common Shares (WSR): Price and Financial Metrics
WSR Price/Volume Stats
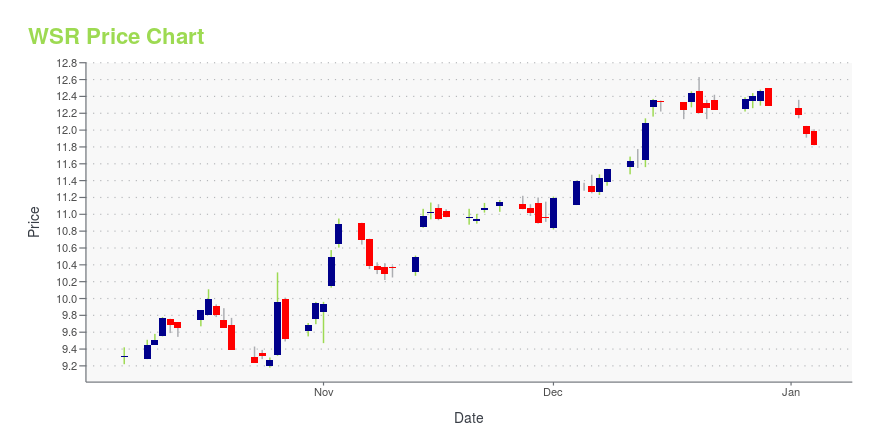
| Current price | $10.81 | 52-week high | $13.12 |
| Prev. close | $10.86 | 52-week low | $8.21 |
| Day low | $10.79 | Volume | 196,300 |
| Day high | $10.94 | Avg. volume | 333,930 |
| 50-day MA | $12.08 | Dividend yield | 4.52% |
| 200-day MA | $11.02 | Market Cap | 540.05M |
WSR Stock Price Chart Interactive Chart >
Whitestone REIT Common Shares (WSR) Company Bio
Whitestone REIT is engaged in owning and operating commercial properties in culturally diverse markets in major metropolitan areas. The firm was formerly known as Hartman Commercial Properties REIT. The company was founded on 1998 and is based in Houston, Texas.
Latest WSR News From Around the Web
Below are the latest news stories about WHITESTONE REIT that investors may wish to consider to help them evaluate WSR as an investment opportunity.
Whitestone REIT Board of Trustees Responds to Proposal from Bruce Schanzer / Erez Asset Management, LLC (“Erez”)HOUSTON, Dec. 13, 2023 (GLOBE NEWSWIRE) -- Whitestone REIT (NYSE:WSR) (“Whitestone” or the “Company”) announced today that, after careful review and consideration, the Board of Trustees of Whitestone has unanimously rejected a proposal by Bruce Schanzer, Chairman of Erez, demanding a majority change in our Board of Trustees with the sole purpose of embarking on an immediate sale or liquidation of Whitestone, without regard for maximizing long-term value for shareholders. For the sake of transpar |
Court Dismisses All Claims By Former CEO Against Whitestone REITHOUSTON, Dec. 11, 2023 (GLOBE NEWSWIRE) -- Whitestone REIT (NYSE: WSR) (“Whitestone” or the “Company”) is pleased to announce that on Friday, December 8, 2023, the District Court in Harris County, Texas dismissed all claims made by former Whitestone CEO, James C. Mastandrea, against the Company and members of the Board of Trustees and management related to the termination of his employment. The lawsuit was filed by Mr. Mastandrea following his removal from the Company by the Board of Trustees in |
Whitestone REIT Declares First Quarter 2024 DividendHOUSTON, Dec. 05, 2023 (GLOBE NEWSWIRE) -- Whitestone REIT (NYSE: WSR) (“Whitestone” or the “Company”) today announced that its Board of Trustees has declared a monthly cash dividend of $0.04 per share on the Company's common shares and operating partnership units for the first quarter of 2024. The dividend increase represents a quarterly amount of $0.12 per share, and an annualized amount of $0.48 per share. “We are focused on delivering consistent growth, driven by very strong leasing spreads |
13 Cheap Monthly Dividend Stocks to BuyIn this article, we discuss 13 cheap monthly dividend stocks to buy. You can skip our detailed analysis of dividend stocks and their previous performance, and go directly to read 5 Cheap Monthly Dividend Stocks to Buy. According to a Wisdom Tree report, dividends have increased by an average of 5.7% annually since 1957—over 2% […] |
The 3 Best-Performing Retail REITs Over The Past YearThe past year has been difficult for real estate investment trusts (REITs), and one of the worst-performing subsectors has been retail REITs. Only nine of 27 REITs in this group have been profitable over the past year. The headwinds in 2023 have been numerous, including inflation, interest rate hikes, fears of recession, fears of Amazon.com Inc. (NASDAQ:AMZN) and other online retailers drawing sales away from mall and stand-alone retailers. But anyone who visited a local mall in 2023 could see t |
WSR Price Returns
| 1-mo | -10.37% |
| 3-mo | -13.99% |
| 6-mo | 17.52% |
| 1-year | 23.41% |
| 3-year | 27.65% |
| 5-year | 16.78% |
| YTD | -10.90% |
| 2023 | 33.96% |
| 2022 | -0.89% |
| 2021 | 33.36% |
| 2020 | -37.17% |
| 2019 | 20.34% |
WSR Dividends
| Ex-Dividend Date | Type | Payout Amount | Change | ||||||
|---|---|---|---|---|---|---|---|---|---|
| Loading, please wait... | |||||||||
Continue Researching WSR
Here are a few links from around the web to help you further your research on Whitestone REIT's stock as an investment opportunity:Whitestone REIT (WSR) Stock Price | Nasdaq
Whitestone REIT (WSR) Stock Quote, History and News - Yahoo Finance
Whitestone REIT (WSR) Stock Price and Basic Information | MarketWatch
Loading social stream, please wait...