
Alamos Gold Inc. Class A Common Shares (AGI): Price and Financial Metrics
AGI Price/Volume Stats
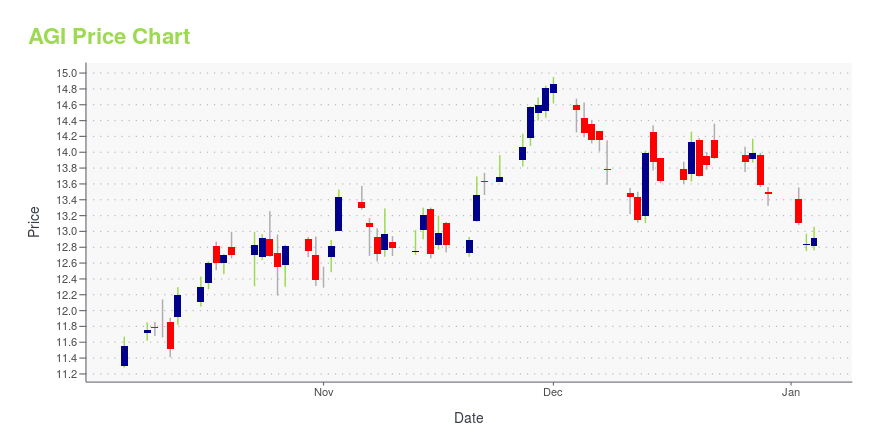
| Current price | $14.94 | 52-week high | $16.01 |
| Prev. close | $14.88 | 52-week low | $10.78 |
| Day low | $14.81 | Volume | 2,083,918 |
| Day high | $15.26 | Avg. volume | 2,586,091 |
| 50-day MA | $13.30 | Dividend yield | 0.66% |
| 200-day MA | $12.73 | Market Cap | 5.94B |
AGI Stock Price Chart Interactive Chart >
Alamos Gold Inc. Class A Common Shares (AGI) Company Bio
Alamos Gold Inc. is a Canadian-based intermediate gold producer with diversified production from three operating mines in North America. The company was founded in 2003 and is based in Toronto, Canada.
Latest AGI News From Around the Web
Below are the latest news stories about ALAMOS GOLD INC that investors may wish to consider to help them evaluate AGI as an investment opportunity.
Ranchero Announces Proposed Disposition of the Santa Daniela Property for a Total Consideration of Up to US$5.05mVANCOUVER, British Columbia, Dec. 27, 2023 (GLOBE NEWSWIRE) -- Ranchero Gold Corp. (“Ranchero” or the “Company”) (TSX.V:RNCH) is pleased to announce that its wholly-owned subsidiary Minera y Metalurgia Paika, S.A. de C.V. (“Paika”) has entered into a letter of intent dated December 22, 2023 (the “LOI”) with Minas de Oro Nacional, S.A. de C.V. (“Minas de Oro”), a wholly-owned subsidiary of Alamos Gold Inc. (TSX:AGI), for the proposed sale of Paika’s interest in four mineral licenses (the “License |
13 Best Mining Stocks To Buy NowIn this piece, we will take a look at the 13 best mining stocks to buy now. If you want to skip our analysis of the mining industry and want to jump to the top five stocks in this list, head on over to 5 Best Mining Stocks To Buy Now. The global supply of […] |
Universal Stainless (USAP) Up 39% in 6 Months: Here's WhyUniversal Stainless' (USAP) rally reflects a robust third-quarter performance on the back of record aerospace sales. |
Alamos Gold Announces Renewal of Normal Course Issuer BidTORONTO, Dec. 21, 2023 (GLOBE NEWSWIRE) -- Alamos Gold Inc. (TSX:AGI; NYSE:AGI) (“Alamos” or the “Company”) today announced that it has filed with, and received acceptance from the Toronto Stock Exchange (“TSX”) of, a Notice of Intention to make a Normal Course Issuer Bid permitting Alamos to purchase for cancellation up to 34,485,405 Class A Common Shares (“Common Shares”), representing 10% of the Company’s public float of the Common Shares as at December 14, 2023, being 344,854,056 Common Shar |
AngloGold Ashanti (AU) to Boost Portfolio by Investing in G2AngloGold Ashanti (AU) to subscribe to G2 shares as part of its growth initiatives. |
AGI Price Returns
| 1-mo | 11.66% |
| 3-mo | 21.39% |
| 6-mo | 18.06% |
| 1-year | 14.92% |
| 3-year | 75.08% |
| 5-year | 233.10% |
| YTD | 11.12% |
| 2023 | 34.33% |
| 2022 | 33.11% |
| 2021 | -11.28% |
| 2020 | 46.75% |
| 2019 | 68.43% |
AGI Dividends
| Ex-Dividend Date | Type | Payout Amount | Change | ||||||
|---|---|---|---|---|---|---|---|---|---|
| Loading, please wait... | |||||||||
Continue Researching AGI
Here are a few links from around the web to help you further your research on Alamos Gold Inc's stock as an investment opportunity:Alamos Gold Inc (AGI) Stock Price | Nasdaq
Alamos Gold Inc (AGI) Stock Quote, History and News - Yahoo Finance
Alamos Gold Inc (AGI) Stock Price and Basic Information | MarketWatch
Loading social stream, please wait...