Advanced Micro Devices Inc. (AMD): Price and Financial Metrics
GET POWR RATINGS... FREE!
AMD POWR Grades
- Momentum is the dimension where AMD ranks best; there it ranks ahead of 51.58% of US stocks.
- The strongest trend for AMD is in Growth, which has been heading down over the past 177 days.
- AMD ranks lowest in Stability; there it ranks in the 7th percentile.
AMD Stock Summary
- AMD has a market capitalization of $142,387,172,666 -- more than approximately 98.59% of US stocks.
- AMD's went public 37.12 years ago, making it older than 93.49% of listed US stocks we're tracking.
- With a year-over-year growth in debt of 396.56%, ADVANCED MICRO DEVICES INC's debt growth rate surpasses 95.64% of about US stocks.
- Stocks with similar financial metrics, market capitalization, and price volatility to ADVANCED MICRO DEVICES INC are TXN, AMAT, INTC, REGN, and NFLX.
- AMD's SEC filings can be seen here. And to visit ADVANCED MICRO DEVICES INC's official web site, go to www.amd.com.
AMD Valuation Summary
- In comparison to the median Technology stock, AMD's EV/EBIT ratio is 132.16% higher, now standing at 46.2.
- Over the past 243 months, AMD's price/sales ratio has gone up 4.7.
Below are key valuation metrics over time for AMD.
Stock | Date | P/S | P/B | P/E | EV/EBIT |
---|---|---|---|---|---|
AMD | 2023-01-31 | 5.3 | 2.2 | 53.3 | 46.2 |
AMD | 2023-01-30 | 5.1 | 2.1 | 51.4 | 44.5 |
AMD | 2023-01-27 | 5.3 | 2.2 | 53.5 | 46.4 |
AMD | 2023-01-26 | 5.3 | 2.2 | 53.3 | 46.2 |
AMD | 2023-01-25 | 5.3 | 2.2 | 53.1 | 46.1 |
AMD | 2023-01-24 | 5.3 | 2.2 | 53.0 | 45.9 |
AMD Growth Metrics
- Its year over year price growth rate is now at 18.33%.
- Its year over year cash and equivalents growth rate is now at 168.86%.
- Its 4 year revenue growth rate is now at 63.77%.

The table below shows AMD's growth in key financial areas (numbers in millions of US dollars).
Date | Revenue | Operating Cash Flow | Net Income to Common Stock |
---|---|---|---|
2022-09-30 | 22,828 | 3,820 | 2,273 |
2022-06-30 | 21,576 | 3,704 | 3,130 |
2022-03-31 | 18,876 | 3,618 | 3,393 |
2021-12-31 | 16,434 | 3,521 | 3,162 |
2021-09-30 | 14,852 | 3,253 | 3,969 |
2021-06-30 | 13,340 | 2,743 | 3,436 |
AMD's Quality Factors
The “Quality” component of the POWR Ratings focuses on 31 different factors of a companies fundamentals and operational strength. Here are some key insights as we drill into the specifics of these quality attributes.- AMD has a Quality Grade of B, ranking ahead of 77.27% of graded US stocks.
- AMD's asset turnover comes in at 1.454 -- ranking 18th of 208 Electronic Equipment stocks.
- AVYA, PLXS, and UCTT are the stocks whose asset turnover ratios are most correlated with AMD.
The table below shows AMD's key quality metrics over time.
Period | Asset Turnover | Gross Margin | ROIC |
---|---|---|---|
2021-09-25 | 1.454 | 0.468 | 0.562 |
2021-06-26 | 1.453 | 0.457 | 0.494 |
2021-03-27 | 1.401 | 0.448 | 0.412 |
2020-12-26 | 1.374 | 0.445 | 0.360 |
2020-09-26 | 1.356 | 0.445 | 0.327 |
2020-06-27 | 1.289 | 0.444 | 0.253 |
AMD Price Target
For more insight on analysts targets of AMD, see our AMD price target page. And for a list of of all stocks sorted by upside potential based on analyst target price, see our Top Price Target page.
Average Price Target | $117.25 | Average Broker Recommendation | 1.63 (Moderate Buy) |
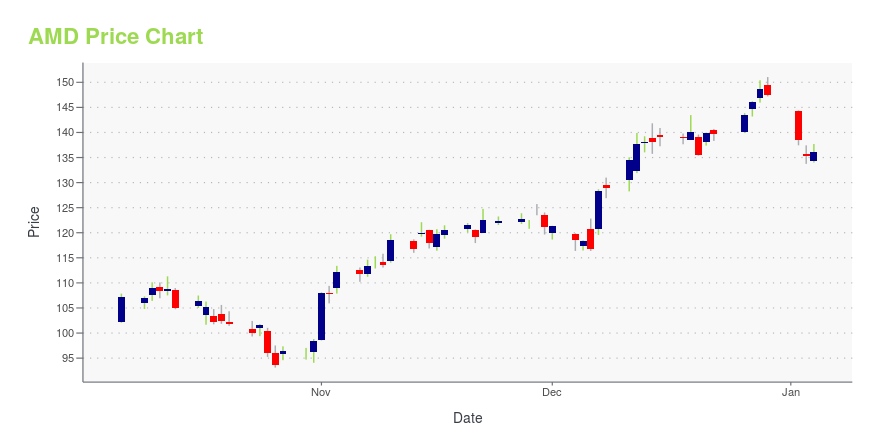
AMD Stock Price Chart Interactive Chart >
AMD Price/Volume Stats
Current price | $86.09 | 52-week high | $132.96 |
Prev. close | $88.31 | 52-week low | $54.57 |
Day low | $85.83 | Volume | 66,557,800 |
Day high | $88.80 | Avg. volume | 60,794,977 |
50-day MA | $70.90 | Dividend yield | N/A |
200-day MA | $79.34 | Market Cap | 138.81B |
Advanced Micro Devices Inc. (AMD) Company Bio
Advanced Micro Devices Inc. was founded in 1969 in Silicon Valley. AMD primarily offers x86 microprocessors, chipsets, discrete and integrated graphics processing units (GPUs), data center and professional GPUs, development services, semi-custom System-on-Chip (SoC) products, development services and technology for game consoles. AMD develops and primarily sells its products and services to the gaming and business communities. AMD’s main competitor in the processor market is Intel Corp., while the company primarily competes against NVIDIA Corp. for the computer graphics and data center industries. AMD looks to continue to "highlight our product portfolio across the PC, gaming and data center markets" for 2021, according to CEO and President Dr. Lisa Su.
Latest AMD News From Around the Web
Below are the latest news stories about ADVANCED MICRO DEVICES INC that investors may wish to consider to help them evaluate AMD as an investment opportunity.
Most Active Equity Options For Midday - Friday, Feb. 3Here are the most active equity options for midday. |
AMD, Nvidia lead chips higher as investors continue to move back into sectorAMD (NASDAQ:AMD) and Nvidia (NVDA) were among the largest gainers in the semiconductor industry on Thursday as investors continued to flock to the sector after the former's quarterly results were not as bad as feared. AMD (AMD) and Nvidia (Seeking Alpha | February 2, 2023 |
SBUX, QCOM, F Predictions: 3 Hot Stocks for TomorrowFord, Starbucks and Qualcomm all report earnings, making them three of our hot stocks for tomorrow. |
7 Sorry Semiconductor Stocks to Sell in February Before It’s Too LateThese semiconductor stocks to sell should be unloaded because the firm continue to struggle and are weighed down by poor financial results. |
Why Advanced Micro Devices Stock Gained 16% in JanuaryShares of Advanced Micro Devices (NASDAQ: AMD) made gains last month after the chipmaker benefited from a rise in tech stocks, a weak report from rival Intel, and anticipation for its own fourth-quarter earnings report, which came out after market hours on Jan. 31. According to data from S&P Global Market Intelligence, AMD stock rose 16% in January. The Nasdaq gained nearly 11% last month, pushing stocks higher broadly as investors reacted to signs that inflation was cooling off and that the Federal Reserve would continue to slow down its interest rate hikes. |
AMD Price Returns
1-mo | 34.60% |
3-mo | 36.48% |
6-mo | -9.89% |
1-year | -30.35% |
3-year | 74.55% |
5-year | 638.97% |
YTD | 32.92% |
2022 | -54.99% |
2021 | 56.91% |
2020 | 99.98% |
2019 | 148.43% |
2018 | 79.57% |
Continue Researching AMD
Here are a few links from around the web to help you further your research on Advanced Micro Devices Inc's stock as an investment opportunity:Advanced Micro Devices Inc (AMD) Stock Price | Nasdaq
Advanced Micro Devices Inc (AMD) Stock Quote, History and News - Yahoo Finance
Advanced Micro Devices Inc (AMD) Stock Price and Basic Information | MarketWatch
Loading social stream, please wait...