Columbia Sportswear Company (COLM): Price and Financial Metrics
COLM Price/Volume Stats
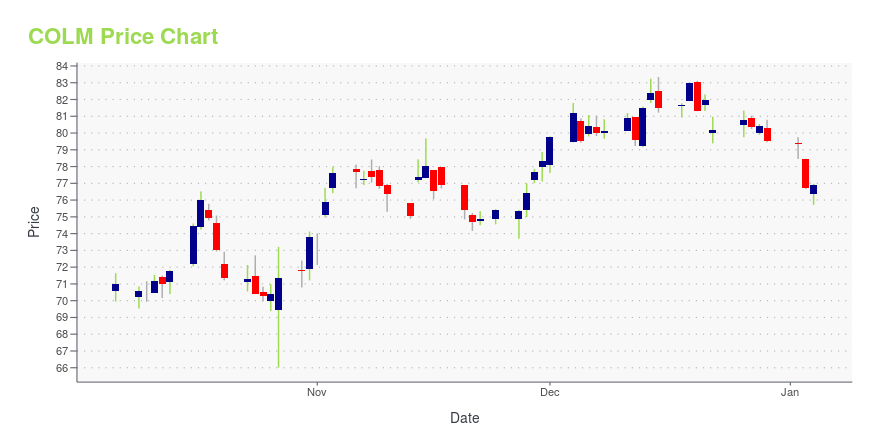
Current price | $73.83 | 52-week high | $98.32 |
Prev. close | $74.61 | 52-week low | $65.02 |
Day low | $72.84 | Volume | 465,500 |
Day high | $74.41 | Avg. volume | 319,622 |
50-day MA | $83.51 | Dividend yield | 1.61% |
200-day MA | $82.37 | Market Cap | 4.58B |
COLM Stock Price Chart Interactive Chart >
COLM POWR Grades
- COLM scores best on the Quality dimension, with a Quality rank ahead of 79.61% of US stocks.
- COLM's strongest trending metric is Growth; it's been moving down over the last 179 days.
- COLM ranks lowest in Growth; there it ranks in the 17th percentile.
COLM Stock Summary
- COLUMBIA SPORTSWEAR CO's market capitalization of $4,585,388,447 is ahead of 75.45% of US-listed equities.
- The price/operating cash flow metric for COLUMBIA SPORTSWEAR CO is higher than 92.72% of stocks in our set with a positive cash flow.
- Of note is the ratio of COLUMBIA SPORTSWEAR CO's sales and general administrative expense to its total operating expenses; 85.07% of US stocks have a lower such ratio.
- Stocks with similar financial metrics, market capitalization, and price volatility to COLUMBIA SPORTSWEAR CO are SITE, DNOW, JLL, IPAR, and TITN.
- Visit COLM's SEC page to see the company's official filings. To visit the company's web site, go to www.columbia.com.
COLM Valuation Summary
- COLM's EV/EBIT ratio is 12.6; this is 9.03% lower than that of the median Consumer Cyclical stock.
- Over the past 243 months, COLM's price/sales ratio has gone down 1.
Below are key valuation metrics over time for COLM.
Stock | Date | P/S | P/B | P/E | EV/EBIT |
---|---|---|---|---|---|
COLM | 2023-05-19 | 1.3 | 2.4 | 16.2 | 12.6 |
COLM | 2023-05-18 | 1.4 | 2.4 | 16.4 | 12.8 |
COLM | 2023-05-17 | 1.3 | 2.4 | 16.3 | 12.7 |
COLM | 2023-05-16 | 1.3 | 2.4 | 16.2 | 12.6 |
COLM | 2023-05-15 | 1.4 | 2.5 | 16.5 | 12.9 |
COLM | 2023-05-12 | 1.4 | 2.5 | 16.7 | 13.0 |
COLM Growth Metrics
- Its 3 year net cashflow from operations growth rate is now at -22.57%.
- The 4 year cash and equivalents growth rate now stands at 20.7%.
- The 5 year cash and equivalents growth rate now stands at 20.7%.

The table below shows COLM's growth in key financial areas (numbers in millions of US dollars).
Date | Revenue | Operating Cash Flow | Net Income to Common Stock |
---|---|---|---|
2022-12-31 | 3,464.152 | -25.241 | 311.44 |
2022-09-30 | 3,424.352 | 41.955 | 342.711 |
2022-06-30 | 3,273.999 | 124.576 | 331.524 |
2022-03-31 | 3,262.306 | 209.719 | 365.045 |
2021-12-31 | 3,126.402 | 354.406 | 354.108 |
2021-09-30 | 2,912.305 | 458.399 | 292.903 |
COLM's Quality Factors
The “Quality” component of the POWR Ratings focuses on 31 different factors of a companies fundamentals and operational strength. Here are some key insights as we drill into the specifics of these quality attributes.- COLM has a Quality Grade of B, ranking ahead of 91.2% of graded US stocks.
- COLM's asset turnover comes in at 1.008 -- ranking 15th of 32 Apparel stocks.
- RL, SHOO, and LEVI are the stocks whose asset turnover ratios are most correlated with COLM.
The table below shows COLM's key quality metrics over time.
Period | Asset Turnover | Gross Margin | ROIC |
---|---|---|---|
2021-06-30 | 1.008 | 0.506 | 0.174 |
2021-03-31 | 0.939 | 0.498 | 0.113 |
2020-12-31 | 0.921 | 0.489 | 0.074 |
2020-09-30 | 0.927 | 0.488 | 0.082 |
2020-06-30 | 0.994 | 0.489 | 0.116 |
2020-03-31 | 1.066 | 0.491 | 0.161 |
COLM Price Target
For more insight on analysts targets of COLM, see our COLM price target page. And for a list of of all stocks sorted by upside potential based on analyst target price, see our Top Price Target page.
Average Price Target | $124.53 | Average Broker Recommendation | 1.55 (Moderate Buy) |
Columbia Sportswear Company (COLM) Company Bio
Columbia Sportswear designs, sources, markets, and distributes outdoor and active lifestyle apparel, footwear, accessories, and equipment in the United States, Latin America, the Asia Pacific, Europe, the Middle East, Africa, and Canada. The company was founded in 1938 and is based in Portland, Oregon.
Latest COLM News From Around the Web
Below are the latest news stories about COLUMBIA SPORTSWEAR CO that investors may wish to consider to help them evaluate COLM as an investment opportunity.
Slowing Rates Of Return At Columbia Sportswear (NASDAQ:COLM) Leave Little Room For ExcitementWhat are the early trends we should look for to identify a stock that could multiply in value over the long term... |
Columbia Sportswear (NASDAQ:COLM) Has Announced A Dividend Of $0.30The board of Columbia Sportswear Company ( NASDAQ:COLM ) has announced that it will pay a dividend of $0.30 per share... |
Columbia Sportswear (COLM) Q1 Earnings Miss Estimates, Dip Y/YColumbia Sportswear's (COLM) first-quarter 2023 results reflect increased sales backed by solid consumer demand. However, elevated costs weigh on the bottom line. |
Q1 2023 Columbia Sportswear Co Earnings CallQ1 2023 Columbia Sportswear Co Earnings Call |
Columbia Sportswear (COLM) Q1 Earnings Lag EstimatesColumbia Sportswear (COLM) delivered earnings and revenue surprises of -15.91% and 0.86%, respectively, for the quarter ended March 2023. Do the numbers hold clues to what lies ahead for the stock? |
COLM Price Returns
1-mo | -8.77% |
3-mo | -17.35% |
6-mo | -18.42% |
1-year | -3.31% |
3-year | 1.44% |
5-year | -12.59% |
YTD | -15.08% |
2022 | -8.79% |
2021 | 12.63% |
2020 | -12.50% |
2019 | 20.33% |
2018 | 18.23% |
COLM Dividends
Ex-Dividend Date | Type | Payout Amount | Change | ||||||
---|---|---|---|---|---|---|---|---|---|
Loading, please wait... |
Continue Researching COLM
Want to see what other sources are saying about Columbia Sportswear Co's financials and stock price? Try the links below:Columbia Sportswear Co (COLM) Stock Price | Nasdaq
Columbia Sportswear Co (COLM) Stock Quote, History and News - Yahoo Finance
Columbia Sportswear Co (COLM) Stock Price and Basic Information | MarketWatch
Loading social stream, please wait...