Callaway Golf Company (ELY): Price and Financial Metrics
GET POWR RATINGS... FREE!
ELY POWR Grades
- Value is the dimension where ELY ranks best; there it ranks ahead of 53.99% of US stocks.
- The strongest trend for ELY is in Quality, which has been heading down over the past 179 days.
- ELY ranks lowest in Growth; there it ranks in the 3rd percentile.
ELY Stock Summary
- With a year-over-year growth in debt of 229.96%, Callaway Golf Co's debt growth rate surpasses 95.04% of about US stocks.
- Over the past twelve months, ELY has reported earnings growth of -682.37%, putting it ahead of merely 3.07% of US stocks in our set.
- As for revenue growth, note that ELY's revenue has grown 97.14% over the past 12 months; that beats the revenue growth of 91.54% of US companies in our set.
- Stocks that are quantitatively similar to ELY, based on their financial statements, market capitalization, and price volatility, are CVV, RM, CNDT, SATS, and CRMT.
- ELY's SEC filings can be seen here. And to visit Callaway Golf Co's official web site, go to www.callawaygolf.com.
ELY Valuation Summary
- In comparison to the median Consumer Cyclical stock, ELY's EV/EBIT ratio is 8.98% lower, now standing at 15.2.
- Over the past 243 months, ELY's price/earnings ratio has gone down 3.3.
- ELY's EV/EBIT ratio has moved up 5.2 over the prior 243 months.
Below are key valuation metrics over time for ELY.
Stock | Date | P/S | P/B | P/E | EV/EBIT |
---|---|---|---|---|---|
ELY | 2021-08-27 | 2.2 | 1.4 | 14.4 | 15.2 |
ELY | 2021-08-26 | 2.2 | 1.4 | 14.1 | 15.1 |
ELY | 2021-08-25 | 2.2 | 1.4 | 14.4 | 15.3 |
ELY | 2021-08-24 | 2.2 | 1.4 | 14.4 | 15.3 |
ELY | 2021-08-23 | 2.2 | 1.4 | 14.0 | 15.0 |
ELY | 2021-08-20 | 2.2 | 1.4 | 14.1 | 15.1 |
ELY Growth Metrics
- Its 5 year net cashflow from operations growth rate is now at 129.38%.
- Its 2 year price growth rate is now at -28.36%.
- Its 2 year net income to common stockholders growth rate is now at -23.49%.

The table below shows ELY's growth in key financial areas (numbers in millions of US dollars).
Date | Revenue | Operating Cash Flow | Net Income to Common Stock |
---|---|---|---|
2021-12-31 | 3,133.447 | 278.257 | 321.988 |
2021-09-30 | 2,796.352 | 352.491 | 307.638 |
2021-06-30 | 2,415.45 | 349.026 | 376.061 |
2021-03-31 | 1,798.805 | 243.304 | 116.633 |
2020-12-31 | 1,589.46 | 228.238 | -126.934 |
2020-09-30 | 1,526.772 | 145.248 | -115.576 |
ELY's Quality Factors
The “Quality” component of the POWR Ratings focuses on 31 different factors of a companies fundamentals and operational strength. Here are some key insights as we drill into the specifics of these quality attributes.- ELY has a Quality Grade of C, ranking ahead of 68.07% of graded US stocks.
- ELY's asset turnover comes in at 0.527 -- ranking 17th of 21 Recreation stocks.
- KOSS, HAS, and NLS are the stocks whose asset turnover ratios are most correlated with ELY.
The table below shows ELY's key quality metrics over time.
Period | Asset Turnover | Gross Margin | ROIC |
---|---|---|---|
2021-06-30 | 0.527 | 0.507 | 0.149 |
2021-03-31 | 0.557 | 0.440 | 0.086 |
2020-12-31 | 0.801 | 0.414 | -0.048 |
2020-09-30 | 0.771 | 0.425 | -0.042 |
2020-06-30 | 0.756 | 0.433 | -0.062 |
2020-03-31 | 0.825 | 0.445 | 0.077 |
ELY Price Target
For more insight on analysts targets of ELY, see our ELY price target page. And for a list of of all stocks sorted by upside potential based on analyst target price, see our Top Price Target page.
Average Price Target | $40.00 | Average Broker Recommendation | 1.4 (Strong Buy) |
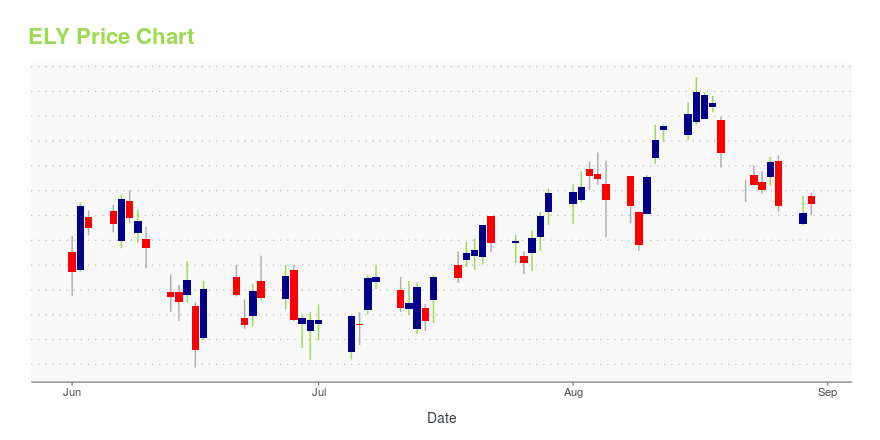
ELY Stock Price Chart Interactive Chart >
ELY Price/Volume Stats
Current price | $20.40 | 52-week high | $34.24 |
Prev. close | $20.40 | 52-week low | $17.78 |
Day low | $19.98 | Volume | 1,010,700 |
Day high | $20.71 | Avg. volume | 1,897,679 |
50-day MA | $21.16 | Dividend yield | N/A |
200-day MA | $24.82 | Market Cap | 3.77B |
Callaway Golf Company (ELY) Company Bio
Callaway Golf manufactures and sells golf clubs and golf balls, and sells golf accessories, under the Callaway Golf and Odyssey brands worldwide. The company was founded in 1982 and is based in Carlsbad, California.
Latest ELY News From Around the Web
Below are the latest news stories about Callaway Golf Co that investors may wish to consider to help them evaluate ELY as an investment opportunity.
Callaway Golf: A Great Buying Opportunity Post EarningsSummary Callaway Golf (ELY) has been in a slump since it peaked at $37/share last summer as investors continue to price in the potential of a post-pandemic slowdown in the world of golf. Although shares have fallen 35% over the last nine months, the widely-known golf manufacturer is still trading... |
Callaway Just Reported Earnings: Here's What Shareholders Need to KnowCallaway is seeing growth across the board, but Topgolf is the segment that should have investors most excited. |
Callaway Golf Company -- Moody's assigns B1 to Callaway's new term loan, affirms the CFR at B1; outlook remains negativeRating Action: Moody's assigns B1 to Callaway's new term loan, affirms the CFR at B1; outlook remains negativeGlobal Credit Research - 17 Feb 2022New York, February 17, 2022 -- Moody's Investors Service ("Moody's") affirmed Callaway Golf Company's ("Callaway") Corporate Family Rating ("CFR") at B1 and Probability of Default Rating at B1-PD. Moody's also assigned a B1 rating to the company's new senior secured term loan B. The company's Speculative Grade Liquidity is unchanged at SGL-2. |
Jefferies Maintains a Buy Rating on Callaway Golf (ELY)Jefferies analyst Randal Konik maintained a Buy rating on Callaway Golf (ELY – Research Report) today and set a price target of $60.00. The company's shares closed last Tuesday at $24.93. According to TipRanks.com, Konik is a 5-star analyst with an average return of 11.3% and a 59.0% success rate. Konik covers the Consumer Goods sector, focusing on stocks such as Lulu's Fashion Lounge Holdings, aka Brands Holding Corp, and Lululemon Athletica. Callaway Golf has an analyst consensus of Strong Buy, with a price target consensus of $41.57, representing a 74.4% upside. |
Callaway Golf is a top stock pick at StephensStephens upgraded Callaway Golf Company (ELY) to an Overweight rating on Monday after having the athletic apparel stock slotted at Neutral. Read more. |
ELY Price Returns
1-mo | -8.31% |
3-mo | -8.97% |
6-mo | -24.72% |
1-year | N/A |
3-year | 14.73% |
5-year | 63.58% |
YTD | -25.66% |
2021 | 14.29% |
2020 | 13.39% |
2019 | 38.88% |
2018 | 10.07% |
2017 | 27.51% |
Continue Researching ELY
Want to see what other sources are saying about Callaway Golf Co's financials and stock price? Try the links below:Callaway Golf Co (ELY) Stock Price | Nasdaq
Callaway Golf Co (ELY) Stock Quote, History and News - Yahoo Finance
Callaway Golf Co (ELY) Stock Price and Basic Information | MarketWatch
Loading social stream, please wait...