Gilead Sciences Inc. (GILD): Price and Financial Metrics
GILD Price/Volume Stats
Current price | $77.65 | 52-week high | $89.74 |
Prev. close | $76.60 | 52-week low | $72.87 |
Day low | $76.20 | Volume | 5,400,400 |
Day high | $77.66 | Avg. volume | 5,766,435 |
50-day MA | $76.71 | Dividend yield | 4.03% |
200-day MA | $78.37 | Market Cap | 96.76B |
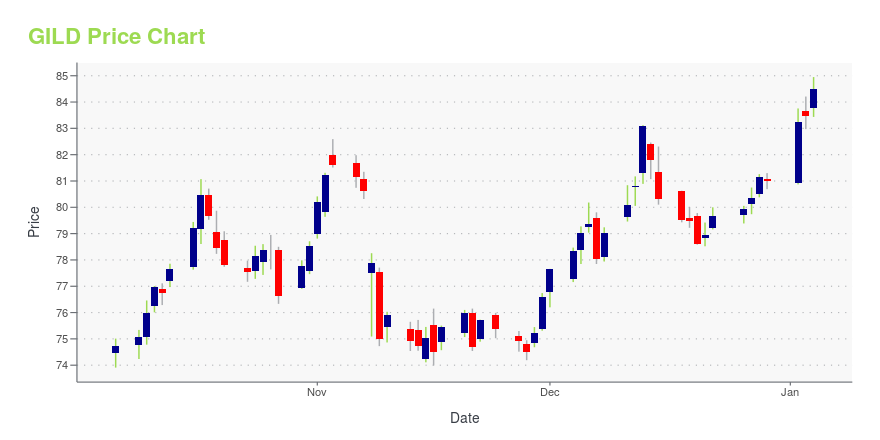
GILD Stock Price Chart Interactive Chart >
GILD POWR Grades
- Value is the dimension where GILD ranks best; there it ranks ahead of 96.18% of US stocks.
- The strongest trend for GILD is in Growth, which has been heading up over the past 177 days.
- GILD's current lowest rank is in the Momentum metric (where it is better than 4.01% of US stocks).
GILD Stock Summary
- GILD has a higher market value than 97.69% of US stocks; more precisely, its current market capitalization is $94,599,500,668.
- GILD's went public 31.83 years ago, making it older than 83.17% of listed US stocks we're tracking.
- In terms of volatility of its share price, GILD is more volatile than merely 1.12% of stocks we're observing.
- Stocks that are quantitatively similar to GILD, based on their financial statements, market capitalization, and price volatility, are NTES, ADI, TXN, PYPL, and BMY.
- Visit GILD's SEC page to see the company's official filings. To visit the company's web site, go to www.gilead.com.
GILD Valuation Summary
- GILD's price/earnings ratio is 18.5; this is 23.87% lower than that of the median Healthcare stock.
- Over the past 243 months, GILD's price/sales ratio has gone down 11.7.
Below are key valuation metrics over time for GILD.
Stock | Date | P/S | P/B | P/E | EV/EBIT |
---|---|---|---|---|---|
GILD | 2023-11-03 | 3.7 | 4.8 | 18.5 | 14.6 |
GILD | 2023-11-02 | 3.7 | 4.8 | 18.5 | 14.5 |
GILD | 2023-11-01 | 3.6 | 4.7 | 18.2 | 14.4 |
GILD | 2023-10-31 | 3.6 | 4.6 | 17.8 | 14.1 |
GILD | 2023-10-30 | 3.5 | 4.6 | 17.7 | 14.0 |
GILD | 2023-10-27 | 3.5 | 4.5 | 17.4 | 13.8 |
GILD Growth Metrics
- Its 4 year net income to common stockholders growth rate is now at -60.73%.
- Its 5 year net cashflow from operations growth rate is now at -41.74%.
- The 5 year net income to common stockholders growth rate now stands at -60.73%.

The table below shows GILD's growth in key financial areas (numbers in millions of US dollars).
Date | Revenue | Operating Cash Flow | Net Income to Common Stock |
---|---|---|---|
2022-12-31 | 27,281 | 9,072 | 4,592 |
2022-09-30 | 27,136 | 9,710 | 3,334 |
2022-06-30 | 27,515 | 10,100 | 4,137 |
2022-03-31 | 27,472 | 10,614 | 4,515 |
2021-12-31 | 27,305 | 11,384 | 6,225 |
2021-09-30 | 27,482 | 10,095 | 7,394 |
GILD's Quality Factors
The “Quality” component of the POWR Ratings focuses on 31 different factors of a companies fundamentals and operational strength. Here are some key insights as we drill into the specifics of these quality attributes.- GILD has a Quality Grade of B, ranking ahead of 89.87% of graded US stocks.
- GILD's asset turnover comes in at 0.406 -- ranking 114th of 682 Pharmaceutical Products stocks.
- ENTA, RDUS, and ADMS are the stocks whose asset turnover ratios are most correlated with GILD.
The table below shows GILD's key quality metrics over time.
Period | Asset Turnover | Gross Margin | ROIC |
---|---|---|---|
2021-09-30 | 0.406 | 0.805 | 0.259 |
2021-06-30 | 0.402 | 0.801 | 0.179 |
2021-03-31 | 0.405 | 0.806 | 0.066 |
2020-12-31 | 0.403 | 0.815 | 0.058 |
2020-09-30 | 0.389 | 0.790 | 0.058 |
2020-06-30 | 0.375 | 0.786 | 0.009 |
GILD Price Target
For more insight on analysts targets of GILD, see our GILD price target page. And for a list of of all stocks sorted by upside potential based on analyst target price, see our Top Price Target page.
Average Price Target | $75.84 | Average Broker Recommendation | 1.7 (Moderate Buy) |
Gilead Sciences Inc. (GILD) Company Bio
Gilead Sciences Inc. is a biopharmaceutical company that discovers, develops, and commercializes new medicines in areas of unmet medical need. Its products target a number of areas, such as HIV, liver diseases, cardiovascular and other diseases. Daniel O’Day has been Gilead Science’s Chief Executive Officer since March of 2019 and the company is headquartered in Foster City, California. With over 10,000 employees worldwide, the company has operations in North America, Asia, the Middle East and Europe. As of 2019, the company had global sales of $22.1 billion. Some of Gilead Science’s major competitors are Novo Nordisk A/S ADR (NVO), Biogen Inc. (BIIB), and Novartis AG ADR (NVS).
Latest GILD News From Around the Web
Below are the latest news stories about GILEAD SCIENCES INC that investors may wish to consider to help them evaluate GILD as an investment opportunity.
5 Biotech Stocks Likely to Thrive as Industry Prospects Look BrightNew drug approvals and pipeline progress are likely to help maintain momentum for the Zacks Biomedical and Genetics industry. A strong portfolio and solid pipeline progress position GILD, CRSP, ACAD, DVAX and LGND well amid volatility. |
The Zacks Analyst Blog Highlights Gilead Sciences, Legend Biotech, BeiGene, Exact Sciences and Sarepta TherapeuticsGilead Sciences, Legend Biotech, BeiGene, Exact Sciences and Sarepta Therapeutics are part of the Zacks top Analyst Blog. |
Gilead Sciences: Breaking Barriers to Breast Cancer Care in Rural AreasNORTHAMPTON, MA / ACCESSWIRE / November 21, 2023 / Gilead SciencesClaudia Hardy says she's found her life's mission. As director of Community Health Access and Relations for the O'Neal Comprehensive Cancer Center at the University of Alabama at Birmingham ... |
Gilead Sciences (NASDAQ:GILD) Seems To Use Debt Quite SensiblyDavid Iben put it well when he said, 'Volatility is not a risk we care about. What we care about is avoiding the... |
20 Most Valuable Healthcare Companies in the WorldIn this article, we will look into the 20 most valuable healthcare companies in the world. If you want to skip our detailed analysis, you can go directly to the 5 Most Valuable Healthcare Companies in the World. Healthcare Services Industry: A Market Analysis According to a report by Verified Market Research, the global healthcare […] |
GILD Price Returns
1-mo | -4.41% |
3-mo | 2.30% |
6-mo | 1.86% |
1-year | -9.49% |
3-year | 44.16% |
5-year | 34.01% |
YTD | -6.91% |
2022 | 23.63% |
2021 | 29.95% |
2020 | -6.70% |
2019 | 7.88% |
2018 | -9.92% |
GILD Dividends
Ex-Dividend Date | Type | Payout Amount | Change | ||||||
---|---|---|---|---|---|---|---|---|---|
Loading, please wait... |
Continue Researching GILD
Want to do more research on Gilead Sciences Inc's stock and its price? Try the links below:Gilead Sciences Inc (GILD) Stock Price | Nasdaq
Gilead Sciences Inc (GILD) Stock Quote, History and News - Yahoo Finance
Gilead Sciences Inc (GILD) Stock Price and Basic Information | MarketWatch
Loading social stream, please wait...