PulteGroup Inc. (PHM): Price and Financial Metrics
PHM Price/Volume Stats
Current price | $94.02 | 52-week high | $94.02 |
Prev. close | $92.46 | 52-week low | $43.62 |
Day low | $92.49 | Volume | 1,118,712 |
Day high | $94.02 | Avg. volume | 2,578,108 |
50-day MA | $79.65 | Dividend yield | 0.7% |
200-day MA | $72.75 | Market Cap | 20.27B |
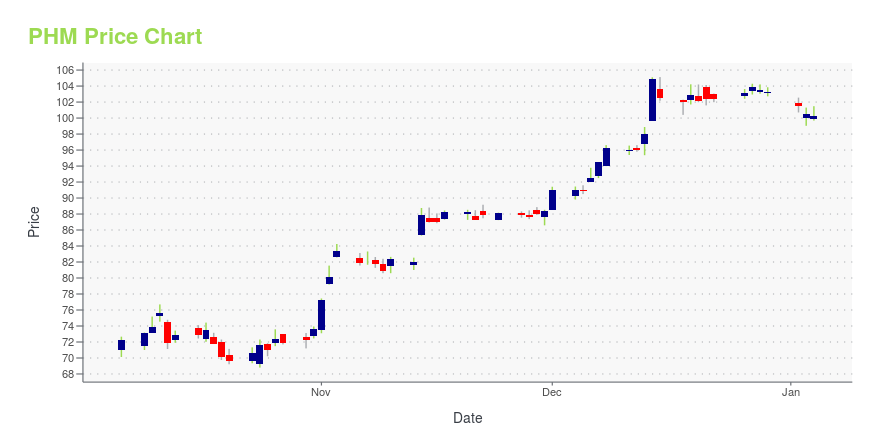
PHM Stock Price Chart Interactive Chart >
PHM POWR Grades
- Momentum is the dimension where PHM ranks best; there it ranks ahead of 99.98% of US stocks.
- PHM's strongest trending metric is Quality; it's been moving up over the last 177 days.
- PHM ranks lowest in Growth; there it ranks in the 32nd percentile.
PHM Stock Summary
- With a market capitalization of $19,623,455,080, PULTEGROUP INC has a greater market value than 89.62% of US stocks.
- PULTEGROUP INC's stock had its IPO on January 1, 1986, making it an older stock than 93.02% of US equities in our set.
- Of note is the ratio of PULTEGROUP INC's sales and general administrative expense to its total operating expenses; 97.78% of US stocks have a lower such ratio.
- Stocks that are quantitatively similar to PHM, based on their financial statements, market capitalization, and price volatility, are HUBB, SNA, BLDR, J, and DOV.
- PHM's SEC filings can be seen here. And to visit PULTEGROUP INC's official web site, go to www.pultegroupinc.com.
PHM Valuation Summary
- In comparison to the median Consumer Cyclical stock, PHM's EV/EBIT ratio is 63.21% lower, now standing at 5.5.
- Over the past 243 months, PHM's price/sales ratio has gone up 0.5.
Below are key valuation metrics over time for PHM.
Stock | Date | P/S | P/B | P/E | EV/EBIT |
---|---|---|---|---|---|
PHM | 2023-12-01 | 1.2 | 2.0 | 7.1 | 5.5 |
PHM | 2023-11-30 | 1.1 | 1.9 | 6.9 | 5.3 |
PHM | 2023-11-29 | 1.1 | 1.9 | 6.8 | 5.3 |
PHM | 2023-11-28 | 1.1 | 1.9 | 6.8 | 5.3 |
PHM | 2023-11-27 | 1.1 | 1.9 | 6.8 | 5.3 |
PHM | 2023-11-24 | 1.1 | 1.9 | 6.8 | 5.3 |
PHM Growth Metrics
- The 4 year net income to common stockholders growth rate now stands at 72.47%.
- Its 3 year net cashflow from operations growth rate is now at -28.11%.
- The 5 year price growth rate now stands at 7.52%.

The table below shows PHM's growth in key financial areas (numbers in millions of US dollars).
Date | Revenue | Operating Cash Flow | Net Income to Common Stock |
---|---|---|---|
2022-12-31 | 16,229 | 668.466 | 2,617.317 |
2022-09-30 | 15,416.17 | 151.871 | 2,398.351 |
2022-06-30 | 14,951.41 | 674.296 | 2,245.972 |
2022-03-31 | 14,384.71 | 1,034.939 | 2,096.936 |
2021-12-31 | 13,926.88 | 1,004.021 | 1,946.32 |
2021-09-30 | 12,760.69 | 1,063.942 | 1,721.166 |
PHM's Quality Factors
The “Quality” component of the POWR Ratings focuses on 31 different factors of a companies fundamentals and operational strength. Here are some key insights as we drill into the specifics of these quality attributes.- PHM has a Quality Grade of B, ranking ahead of 76.12% of graded US stocks.
- PHM's asset turnover comes in at 1.057 -- ranking 32nd of 51 Construction stocks.
- TOL, TPH, and TPC are the stocks whose asset turnover ratios are most correlated with PHM.
The table below shows PHM's key quality metrics over time.
Period | Asset Turnover | Gross Margin | ROIC |
---|---|---|---|
2021-09-30 | 1.057 | 0.266 | 0.173 |
2021-06-30 | 1.039 | 0.262 | 0.166 |
2021-03-31 | 0.998 | 0.258 | 0.153 |
2020-12-31 | 0.961 | 0.252 | 0.139 |
2020-09-30 | 0.977 | 0.246 | 0.132 |
2020-06-30 | 0.979 | 0.240 | 0.122 |
PHM Price Target
For more insight on analysts targets of PHM, see our PHM price target page. And for a list of of all stocks sorted by upside potential based on analyst target price, see our Top Price Target page.
Average Price Target | $68.10 | Average Broker Recommendation | 1.6 (Moderate Buy) |
PulteGroup Inc. (PHM) Company Bio
PulteGroup, Inc. is an American residential home construction company based in Atlanta, Georgia, United States. The company is the 3rd largest home construction company in the United States based on the number of homes closed. In total, the company has built over 775,000 homes. (Source:Wikipedia)
Latest PHM News From Around the Web
Below are the latest news stories about PULTEGROUP INC that investors may wish to consider to help them evaluate PHM as an investment opportunity.
20 States with the Highest Average Home PricesIn this article, we will be analyzing the US housing market crisis while covering the 20 states with the highest average home prices in the US. If you wish to skip our detailed analysis, you can move directly to the 5 States with the Highest Average Home Prices. A Rigid National Housing Crisis The US […] |
5 Stocks That Powered S&P 500 ETF This YearAs the rally has been broad-based, we have highlighted five stocks in ETFs from different industries that have doubled or near to double so far this year. |
Why Is Meritage (MTH) Up 15.4% Since Last Earnings Report?Meritage (MTH) reported earnings 30 days ago. What's next for the stock? We take a look at earnings estimates for some clues. |
PulteGroup Announces Return to Salt Lake City, Utah MarketATLANTA, November 29, 2023--After nearly two decades, one of the nation’s largest homebuilders, PulteGroup, Inc. (NYSE: PHM) has announced plans to reenter the Salt Lake City market. Beginning with two new construction communities under its Pulte Homes brand, the Company will offer single-family homes and townhomes in Jordanelle Ridge, a new master planned community in Heber. Both communities are expected to grand open in early 2024. |
Wall Street Bulls Look Optimistic About PulteGroup (PHM): Should You Buy?The average brokerage recommendation (ABR) for PulteGroup (PHM) is equivalent to a Buy. The overly optimistic recommendations of Wall Street analysts make the effectiveness of this highly sought-after metric questionable. So, is it worth buying the stock? |
PHM Price Returns
1-mo | 14.62% |
3-mo | 16.71% |
6-mo | 31.15% |
1-year | 113.06% |
3-year | 123.31% |
5-year | 281.61% |
YTD | 107.97% |
2022 | -19.22% |
2021 | 34.03% |
2020 | 12.55% |
2019 | 51.33% |
2018 | -20.76% |
PHM Dividends
Ex-Dividend Date | Type | Payout Amount | Change | ||||||
---|---|---|---|---|---|---|---|---|---|
Loading, please wait... |
Continue Researching PHM
Want to do more research on Pultegroup Inc's stock and its price? Try the links below:Pultegroup Inc (PHM) Stock Price | Nasdaq
Pultegroup Inc (PHM) Stock Quote, History and News - Yahoo Finance
Pultegroup Inc (PHM) Stock Price and Basic Information | MarketWatch
Loading social stream, please wait...