Visa Inc. CI A (V): Price and Financial Metrics
GET POWR RATINGS... FREE!
V POWR Grades
- V scores best on the Quality dimension, with a Quality rank ahead of 94.13% of US stocks.
- V's strongest trending metric is Quality; it's been moving up over the last 179 days.
- V's current lowest rank is in the Value metric (where it is better than 11.66% of US stocks).
V Stock Summary
- With a market capitalization of $478,592,119,055, Visa Inc has a greater market value than 99.76% of US stocks.
- V's one year PEG ratio, measuring expected growth in earnings next year relative to current common stock price is 141.95 -- higher than 83.21% of US-listed equities with positive expected earnings growth.
- With a price/sales ratio of 18.79, Visa Inc has a higher such ratio than 92.52% of stocks in our set.
- Stocks that are quantitatively similar to V, based on their financial statements, market capitalization, and price volatility, are UNH, JPM, WMT, PG, and BAC.
- Visit V's SEC page to see the company's official filings. To visit the company's web site, go to usa.visa.com.
V Valuation Summary
- V's price/sales ratio is 19.9; this is 1558.33% higher than that of the median Financial Services stock.
- Over the past 163 months, V's price/sales ratio has gone up 5.7.
- V's price/earnings ratio has moved up 88.8 over the prior 163 months.
Below are key valuation metrics over time for V.
Stock | Date | P/S | P/B | P/E | EV/EBIT |
---|---|---|---|---|---|
V | 2018-09-24 | 15.1 | 9.1 | 31.6 | 23.9 |
V | 2017-09-06 | 12.1 | 6.7 | 33.2 | 19.1 |
V | 2016-10-04 | 12.4 | 5.4 | 31.9 | 23.1 |
V | 2013-12-17 | 14.1 | 6.2 | 33.3 | 22.6 |
V | 2010-10-07 | 7.9 | 2.5 | 22.9 | 12.5 |
V | 2009-12-11 | 9.9 | 3.0 | 29.2 | 15.2 |
V Growth Metrics
- Its year over year net income to common stockholders growth rate is now at -14.58%.
- Its year over year price growth rate is now at 34.46%.
- Its 3 year net cashflow from operations growth rate is now at 87.41%.

The table below shows V's growth in key financial areas (numbers in millions of US dollars).
Date | Revenue | Operating Cash Flow | Net Income to Common Stock |
---|---|---|---|
2021-12-31 | 25,477 | 15,946 | 13,144 |
2021-09-30 | 24,105 | 15,227 | 12,311 |
2021-06-30 | 22,647 | 13,352 | 10,864 |
2021-03-31 | 21,354 | 11,940 | 10,662 |
2020-12-31 | 21,479 | 10,078 | 10,720 |
2020-09-30 | 21,846 | 10,440 | 10,866 |
V's Quality Factors
The “Quality” component of the POWR Ratings focuses on 31 different factors of a companies fundamentals and operational strength. Here are some key insights as we drill into the specifics of these quality attributes.- V has a Quality Grade of B, ranking ahead of 90.16% of graded US stocks.
- V's asset turnover comes in at 0.279 -- ranking 449th of 563 Business Services stocks.
- FC, PGEN, and GOVX are the stocks whose asset turnover ratios are most correlated with V.
The table below shows V's key quality metrics over time.
Period | Asset Turnover | Gross Margin | ROIC |
---|---|---|---|
2021-06-30 | 0.279 | 0.818 | 0.549 |
2021-03-31 | 0.267 | 0.815 | 0.506 |
2020-12-31 | 0.275 | 0.824 | 0.544 |
2020-09-30 | 0.285 | 0.827 | 0.597 |
2020-06-30 | 0.307 | 0.837 | 0.659 |
2020-03-31 | 0.329 | 0.847 | 0.699 |
V Price Target
For more insight on analysts targets of V, see our V price target page. And for a list of of all stocks sorted by upside potential based on analyst target price, see our Top Price Target page.
Average Price Target | $278.05 | Average Broker Recommendation | 1.4 (Moderate Buy) |
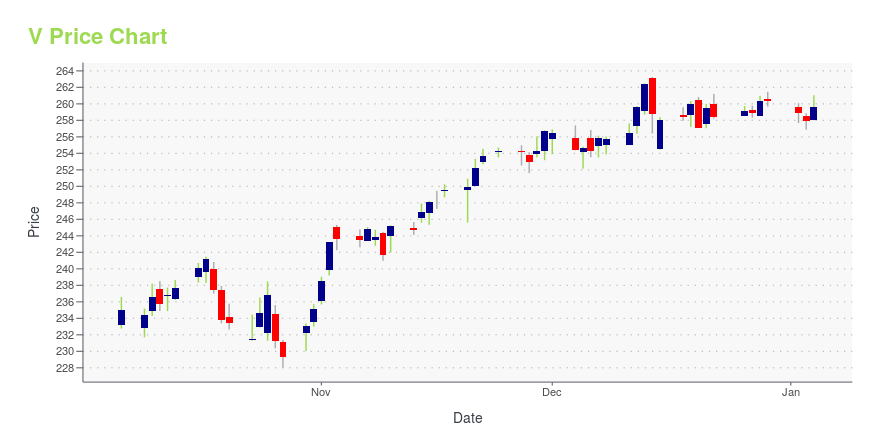
V Stock Price Chart Interactive Chart >
V Price/Volume Stats
Current price | $214.78 | 52-week high | $236.96 |
Prev. close | $217.14 | 52-week low | $185.91 |
Day low | $212.75 | Volume | 3,051,906 |
Day high | $216.18 | Avg. volume | 7,887,571 |
50-day MA | $206.14 | Dividend yield | 0.69% |
200-day MA | $210.65 | Market Cap | 406.02B |
Visa Inc. CI A (V) Company Bio
Visa Inc. stylized as VISA) is an American multinational financial services corporation headquartered in Foster City, California, United States. It facilitates electronic funds transfers throughout the world, most commonly through Visa-branded credit cards, debit cards and prepaid cards. Visa is one of the world's most valuable companies. (Source:Wikipedia)
Latest V News From Around the Web
Below are the latest news stories about Visa Inc that investors may wish to consider to help them evaluate V as an investment opportunity.
Top Research Reports for Berkshire Hathaway, Visa & Cisco SystemsToday's Research Daily features new research reports on 16 major stocks, including Berkshire Hathaway (BRK.B), Visa Inc. (V), and Cisco Systems, Inc. (CSCO). |
Singapore Tech Salaries Jump 22% in Chase for Skilled Coders(Bloomberg) -- Salaries for software engineers in Singapore increased by an average of 22% last year, highlighting the need for qualified talent to sustain the city-state’s burgeoning tech ecosystem, according to a report published this month.Most Read from BloombergRussia Invasion of Ukraine Ignites European Security CrisisU.S. Says It’s Ready to Take in War’s Refugees: Ukraine UpdateRussia Hits Airfields; Kyiv Imposes Martial Law: Ukraine UpdateStocks Rise as Oil Pares Gain After Biden Address |
Visa Stock: Why It’s Now Worth ConsideringVisa (V) and its industry buddy Mastercard (MA) have basically duopolized the payments processing industry. Visa is fundamentally operating a toll booth for all daily transitions, profiting from every single purchase its cardholders make. Accordingly, every single time we swipe our cards for our daily coffee or automatically have our cards charged from Netflix, Visa profits from frictionless and low-risk revenue streams. Additionally, due to the company's long-term affiliation with banking institutions worldwide (as is the case for Mastercard), Visa features an excellent moat. Driven by its industry-prevalent position and high-margin business model, Visa has yielded market-beating returns since its IPO. |
Long-Term Altcoin Investors Should Look at SolanaSolana Pay aims to create a seamless peer-to-peer connection between merchants and consumers, adding to the investment thesis for SOL-USD. |
A Solana NFT Vending Machine Gives SOL Crypto Fans Unique OpportunityAn NFT exchange is giving investors the opportunity to obtain Solana NFTs through a vending machine. |
V Price Returns
1-mo | 3.84% |
3-mo | 9.01% |
6-mo | -3.20% |
1-year | -7.77% |
3-year | 22.85% |
5-year | 116.41% |
YTD | -0.36% |
2021 | -0.31% |
2020 | 17.12% |
2019 | 43.33% |
2018 | 16.49% |
2017 | 47.18% |
V Dividends
Ex-Dividend Date | Type | Payout Amount | Change | ||||||
---|---|---|---|---|---|---|---|---|---|
Loading, please wait... |
Continue Researching V
Want to do more research on Visa Inc's stock and its price? Try the links below:Visa Inc (V) Stock Price | Nasdaq
Visa Inc (V) Stock Quote, History and News - Yahoo Finance
Visa Inc (V) Stock Price and Basic Information | MarketWatch
Loading social stream, please wait...