Exxon Mobil Corp. (XOM): Price and Financial Metrics

Exxon Mobil Corp. (XOM): $119.47

0.73 (-0.61%)

POWR Rating

Component Grades

Momentum

A

Stability

C

Sentiment

Quality

A

Add XOM to Watchlist
Sign Up

Industry: Energy - Oil & Gas

Industry

C

Ranked

#43 of 89

in industry

XOM Price/Volume Stats
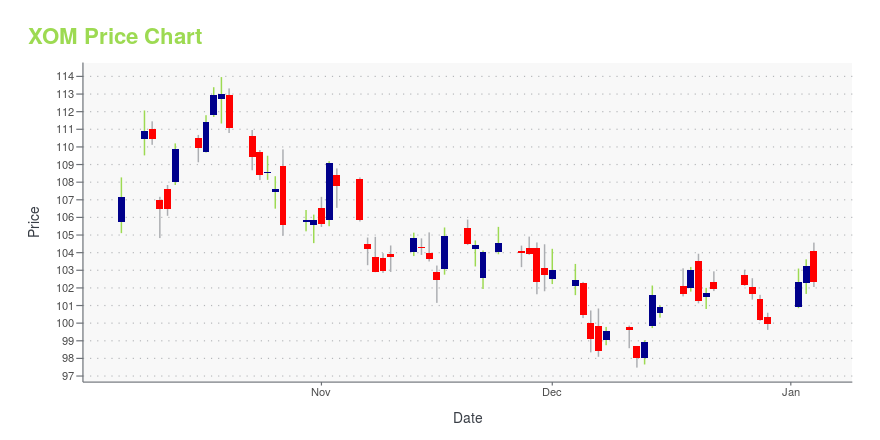
Current price $119.47 52-week high $120.70
Prev. close $120.20 52-week low $87.13
Day low $118.19 Volume 16,808,100
Day high $120.70 Avg. volume 15,968,241
50-day MA $110.91 Dividend yield 3.13%
200-day MA $109.59 Market Cap 478.26B

XOM Stock Price Chart Interactive Chart >

XOM POWR Grades

  • XOM scores best on the Momentum dimension, with a Momentum rank ahead of 99.42% of US stocks.
  • The strongest trend for XOM is in Stability, which has been heading up over the past 177 days.
  • XOM's current lowest rank is in the Value metric (where it is better than 8.94% of US stocks).

XOM Stock Summary

  • EXXON MOBIL CORP's market capitalization of $460,126,978,938 is ahead of 99.74% of US-listed equities.
  • XOM's went public 37.76 years ago, making it older than 93.16% of listed US stocks we're tracking.
  • The volatility of EXXON MOBIL CORP's share price is greater than that of merely 3.4% US stocks with at least 200 days of trading history.
  • If you're looking for stocks that are quantitatively similar to EXXON MOBIL CORP, a group of peers worth examining would be UNH, JPM, WMT, V, and MA.
  • Visit XOM's SEC page to see the company's official filings. To visit the company's web site, go to corporate.exxonmobil.com.

XOM Valuation Summary

  • In comparison to the median Energy stock, XOM's price/earnings ratio is 10.84% higher, now standing at 9.2.
  • Over the past 243 months, XOM's price/sales ratio has gone up 0.2.

Below are key valuation metrics over time for XOM.

Stock Date P/S P/B P/E EV/EBIT
XOM 2023-09-14 1.3 2.4 9.2 6.8
XOM 2023-09-13 1.2 2.3 9.0 6.6
XOM 2023-09-12 1.2 2.4 9.1 6.7
XOM 2023-09-11 1.2 2.3 8.8 6.5
XOM 2023-09-08 1.2 2.3 8.9 6.6
XOM 2023-09-07 1.2 2.3 8.8 6.5

XOM Growth Metrics

    The 4 year price growth rate now stands at -46.81%.
  • Its 5 year revenue growth rate is now at 6.98%.
  • Its 2 year revenue growth rate is now at 23.12%.
XOM's revenue has moved up $1.43328e+11 over the prior 52 months.

The table below shows XOM's growth in key financial areas (numbers in millions of US dollars).

Date Revenue Operating Cash Flow Net Income to Common Stock
2022-12-31 413,680 76,797 55,740
2022-09-30 403,216 76,300 51,860
2022-06-30 364,932 63,966 38,950
2022-03-31 316,993 53,653 25,790
2021-12-31 285,640 48,129 23,040
2021-09-30 247,215 35,010 -5,900

XOM's Quality Factors

The “Quality” component of the POWR Ratings focuses on 31 different factors of a companies fundamentals and operational strength. Here are some key insights as we drill into the specifics of these quality attributes.
  • XOM has a Quality Grade of C, ranking ahead of 71.18% of graded US stocks.
  • XOM's asset turnover comes in at 0.738 -- ranking 26th of 137 Petroleum and Natural Gas stocks.
  • CVI, CLR, and PSX are the stocks whose asset turnover ratios are most correlated with XOM.

The table below shows XOM's key quality metrics over time.

Period Asset Turnover Gross Margin ROIC
2021-09-30 0.738 0.342 -0.018
2021-06-30 0.645 0.334 -0.046
2021-03-31 0.532 0.347 -0.067
2020-12-31 0.516 0.338 -0.077
2020-09-30 0.562 0.347 0.015
2020-06-30 0.614 0.350 0.030

XOM Price Target

For more insight on analysts targets of XOM, see our XOM price target page. And for a list of of all stocks sorted by upside potential based on analyst target price, see our Top Price Target page.

Average Price Target $66.20 Average Broker Recommendation 1.84 (Hold)

Exxon Mobil Corp. (XOM) Company Bio


Exxon Mobil Corp. engages in the exploration and production of crude oil and natural gas.  The company, as we know it today, was formed on November 30, 1999 with the merger of Exxon Corp. and Mobil Corp., creating one of the largest publicly traded international energy companies in the world. In addition to traditional energy operations, Exxon Mobil Chemical is a global chemical company specializing in converting crude oil into petrochemical feedstocks that are used in medical equipment, electronics, clothing, vitamin capsules, tires, and many other products. Exxon currently produces approximately 2.3 million barrels of oil equivalent energy per day.


XOM Latest News Stream


Event/Time News Detail
Loading, please wait...

XOM Latest Social Stream


Loading social stream, please wait...

View Full XOM Social Stream

Latest XOM News From Around the Web

Below are the latest news stories about EXXON MOBIL CORP that investors may wish to consider to help them evaluate XOM as an investment opportunity.

Beware! 7 Energy Stocks Waving Massive Red Flags Right Now

Navigate the energy quagmire knowing which energy stocks to sell at this time to marginalize your portfolio risk

Muslim Farooque on InvestorPlace | September 25, 2023

7 Blue-Chip Stocks That Deserve a Spot on Your Q4 Buy List

It's great to mix up your holdings, but you should always make sure you have a group of great blue-chip stocks to anchor your portfolio.

Louis Navellier and the InvestorPlace Research Staff on InvestorPlace | September 25, 2023

Buy Exxon & McDonald's, Sell Macy's: Strategist's stock picks

Energy stocks are pushing market indices higher in Monday's trading session as oil prices remain elevated. Mahoney Asset Management CEO Ken Mahoney shares some of his latest stock trades and sales, endorsing Exxon Mobil (XOM) and McDonald's (MCD), while advising against buying into Macy's (M) or small cap stocks from the Russell 2000 (^RUT). "For investors, they kind of know the downside, something like $70 a barrel," Mahoney says on Exxon. "I think it's a good way to invest outside of tech as a way to get a decent dividend, more of a value play, and hopefully there is that clip... in the low $70s." "Then you look at Macy's: the entire year they do about $25 billion in revenue," Mahoney compares Macy's sales to Amazon's (AMZN) Prime Day success. "So basically one day in Amazon is about ...

Yahoo | September 25, 2023

14 Best Dividend Kings Stocks to Buy Now

In this article, we discuss 14 best dividend king stocks to buy now. You can skip our detailed analysis of dividend stocks and their performance over the years, and go directly to read 5 Best Dividend Kings Stocks to Buy Now. Dividend Kings are companies that have a remarkable track record of consistently increasing their […]

Yahoo | September 25, 2023

4 Integrated Energy Stocks Set to Escape Industry Weakness

Recessionary concerns & refining business uncertainties are spurring energy market volatility. This is making the outlook for the Zacks Oil and Gas Integrated International industry dull. ExxonMobil (XOM), Chevron (CVX), Shell (SHEL) and YPF Sociedad (YPF) will probably overcome market challenges.

Yahoo | September 25, 2023

Read More 'XOM' Stories Here

XOM Price Returns

1-mo 7.75%
3-mo 12.31%
6-mo 10.79%
1-year 39.17%
3-year 303.66%
5-year 81.65%
YTD 11.00%
2022 87.41%
2021 57.58%
2020 -36.21%
2019 7.23%
2018 -15.09%

XOM Dividends

Ex-Dividend Date Type Payout Amount Change
Loading, please wait...
View Full XOM Dividend History

Continue Researching XOM

Here are a few links from around the web to help you further your research on Exxon Mobil Corp's stock as an investment opportunity:

Exxon Mobil Corp (XOM) Stock Price | Nasdaq
Exxon Mobil Corp (XOM) Stock Quote, History and News - Yahoo Finance
Exxon Mobil Corp (XOM) Stock Price and Basic Information | MarketWatch

Get Free Updates

Join thousands of investors who get the latest news, insights and top rated picks from StockNews.com!