Q4 2018 saw the S&P 500 fall 14%, it’s worst quarterly results in seven years. That helped deliver the worst year for stocks (SPY) (DIA) (QQQ) since 2008, largely caused by growing recession fears in 2019.
While there are certainly lots of risks that COULD lead us into an economic contraction and bear market this year, what investors really want to know is what they SHOULD most likely expect from the American economy in 2019.
So let’s take a look at both what most economists/analysts expect in terms of 2019 growth, what the latest fundamentals actually say is likely, and what it likely means for your portfolio this year.
The Latest 2019 US Growth Forecasts…
While economist and analyst growth estimates are never a sure thing, they can be a good starting point to estimate what US GDP growth is likely to be in 2019.
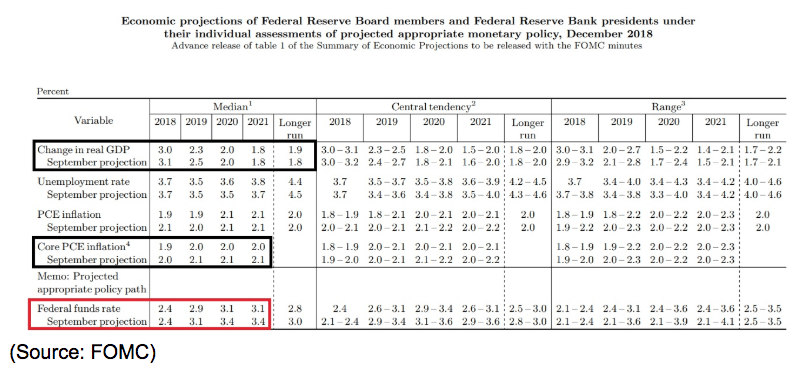 The Federal Reserve’s latest estimate is for 2.3% growth in 2019, which is down slightly compared to three months before. How does that compare to other estimates?
- IMF: 2.5% (includes ongoing trade war with China)
- Deutsche Bank: 2.4%
- OECD: 2.7%
- FedEx (FDX): 2.5%
- Conference Board: 2.7%
- Kiplinger’s: 2.5%
- Tradingeconomics.com: 2.7%
The point is that so far all the leading experts think we’re set for a slowdown from 2018’s roughly 3% growth rate, that will continue in 2020 and 2021. But no actual recession looks likely.
But economists are famous for missing recessions and being overly bullish on growth forecasts (which often come down over time). So let’s take a look at the actual economic data to see how realistic 2+% GDP growth is for 2019.
…Are backed by strong macro data and trends
The first step in determining whether or not the consensus for 2019 is wrong is to ask what would for sure invalidate the estimates. The most obvious answer is a recession. So what are the current risks of two consecutive quarters of contracting growth this year?
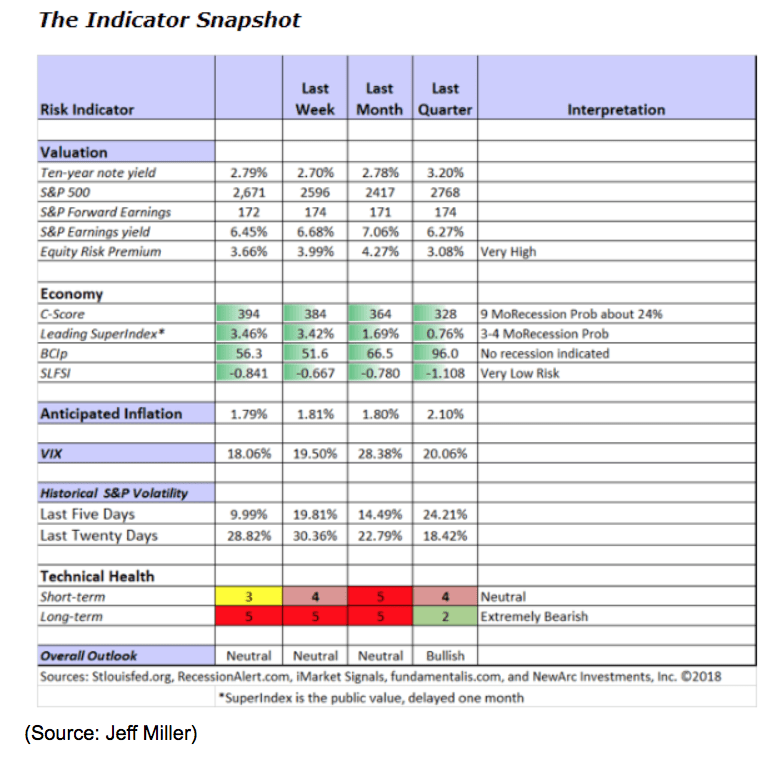 One of the best sources of that data is Jeff Miller’s weekly economic summary, specifically the indicator snapshot. This shows both the probabilities of a recession beginning within the next three to four months as well as the next nine months. Those odds are currently 3.46% for a short-term recession and 24% for one beginning within nine months. Mr. Miller compiles his estimates based on a meta-analysis of various economic models that incorporate dozens of monthly economic reports including leading economic indicators.
Ok, so a recession doesn’t appear likely, though the short-term risks are rising compared to 3 months ago. But to confirm that we’re likely to see 2+% growth this year, let’s look at the hard data, meaning the leading indicators themselves, to see how they are trending and thus whether or not they support such a rosy outlook.
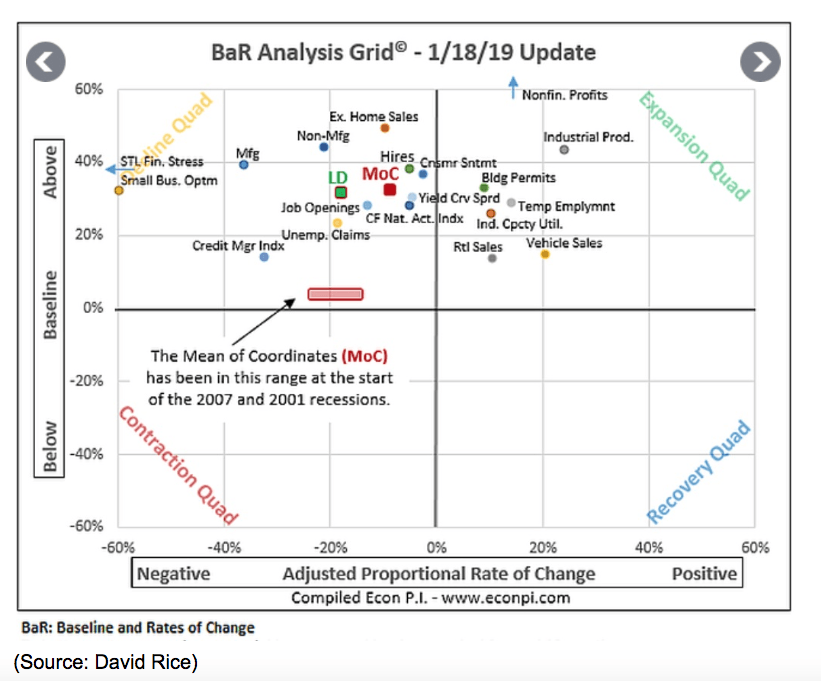
A great source of that data and trends is David Rice’s Economic PI blog where Mr. Rice tracks the 19 leading economic indicators each week. What’s useful about this BaR economic grid is that each indicator is compared to its historical baseline level and is also plotted based on its rate of change (accelerating or decelerating and by how much). This gives a useful graphic representation of how the most important economic fundamentals are holding up.
Currently, 12 of the 19 indicators are pointing to slowing growth and the mean of the coordinates or MOC is firmly in the decline quadrant meaning that the average indicator is slowing down (confirming slower economic growth ahead).
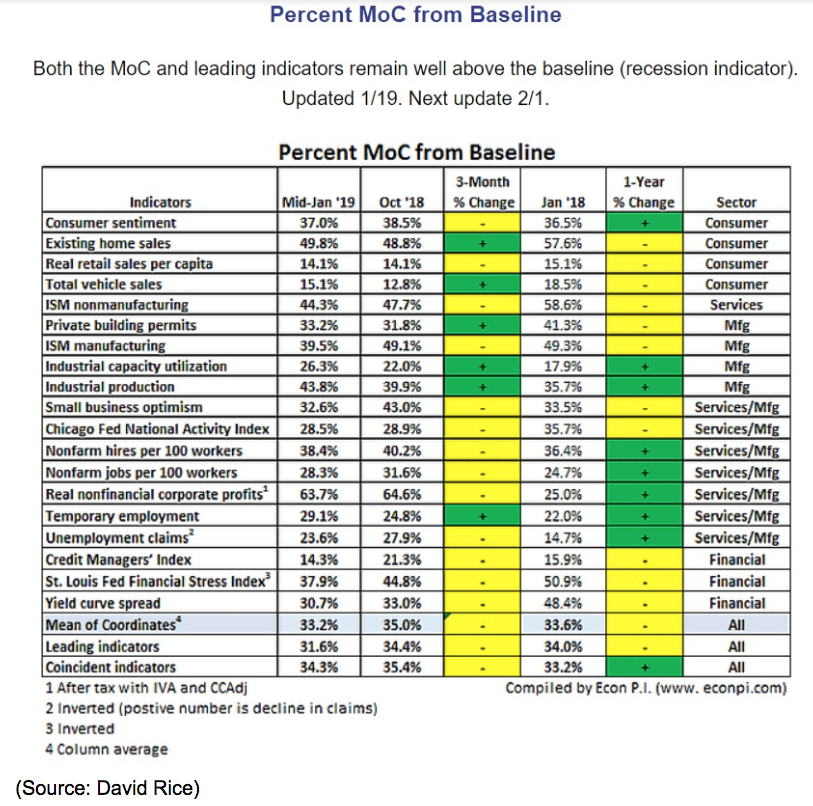
When you use a 3-month trend to smooth out weekly and monthly volatility in report data, you can also see that the number of negative trends has greatly increased as has the number of indicators that are now lower than they were a year ago. So does that mean we’re headed for a recession?
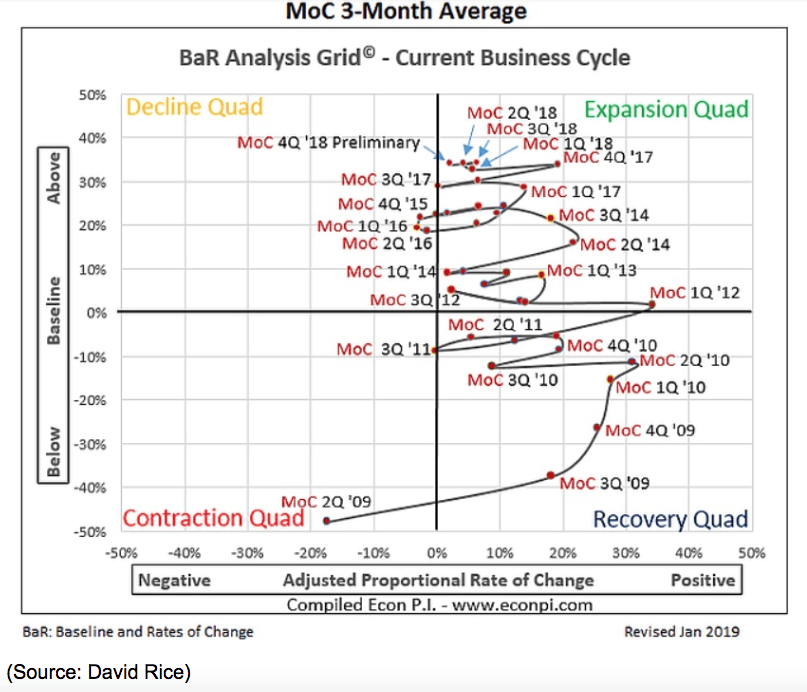
Looking at the 3-month average MOC point over time you can see that the current level is much too high (above baseline) to indicate negative growth is a serious risk. Mind you the MoC’s rate of change has been shifting closer and closer to zero, and if the current economic data continues then it will shift to the most bearish it’s been during this economic expansion.
Rest assured that I track all of these indicators and metanalysis models on a weekly basis (a total of 8) and if a recession becomes likely I’ll let my readers know.
Ok, so it appears that the consensus for 2+% growth this year appears reasonable. But what does that mean for stocks? Well, mostly very good news.
Which Supports Solid Earnings Growth And A Good Year For Stocks
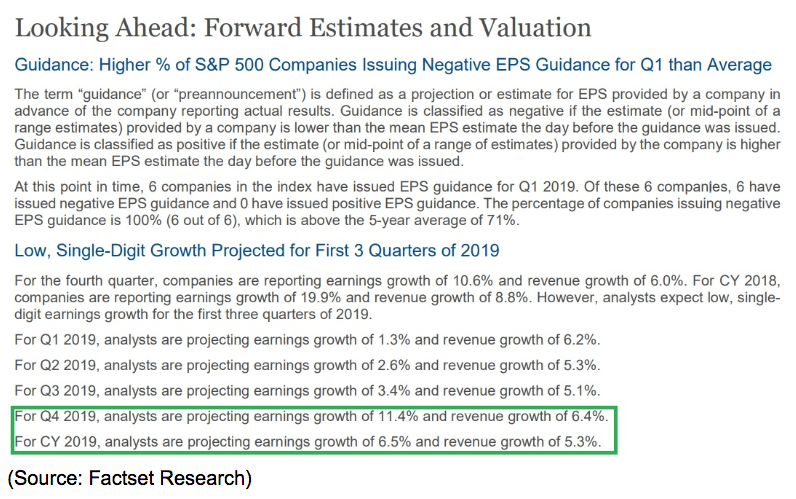
While analysts are famous for bullish earnings growth forecasts that usually come down over time (about 3% to 4% as the quarter progresses) it’s still useful to get an idea of what Wall Street is expecting from S&P 500 earnings growth in 2019.
Thanks to a 45% plunge in crude prices in recent months (followed by a 30% rally in the past month) energy earnings growth expectations have come down significantly and reduced 2019’s EPS growth outlook to 6.5% from its mid-2018 peak estimate of 10.5%. Note that the estimates for Q1 through Q3 are in the low single digits and imply significant margin compression. Why is that? Most likely due to rising input costs created by the trade war and supply chain disruption that comes with higher tariffs.
But notice how each quarter’s growth is expected to speed up until Q4’s growth rate returns to double-digit growth and margins start expanding again. What does Wall Street expect to happen between Q3 and Q4 that might cause growth to triple? Most likely a trade deal that ends the tariffs between the US and China and which China’s latest $1 trillion offer makes far more likely.
Even better news is that 2020’s economic growth, while slower than 2019’s, is still expected to drive strong earnings growth of 11.1%. Of course, that might end up coming down significantly and if we hit a recession in 2020 will prove wildly optimistic.
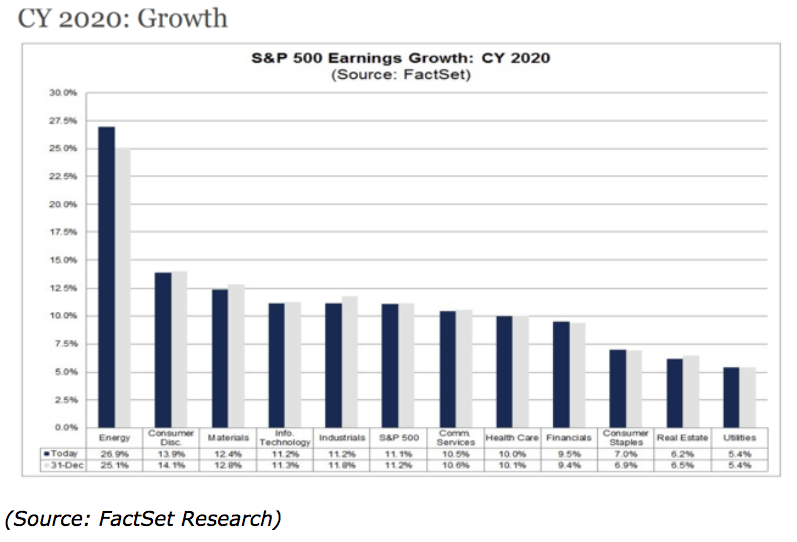
But for the purposes of estimating what stocks might do this year, let’s use the latest forward estimates keeping in mind that these change week to week and what follows is based on current growth expectations being met.
According to JPMorgan Asset Management over the past 20 years, the average forward PE for the S&P 500 has been 16.0. Of course, that’s just the average, which we can think of as representing historical fair value. In reality, the market’s forward valuation swings wildly from overvalued to undervalued and then back again based on short-term investor sentiment.
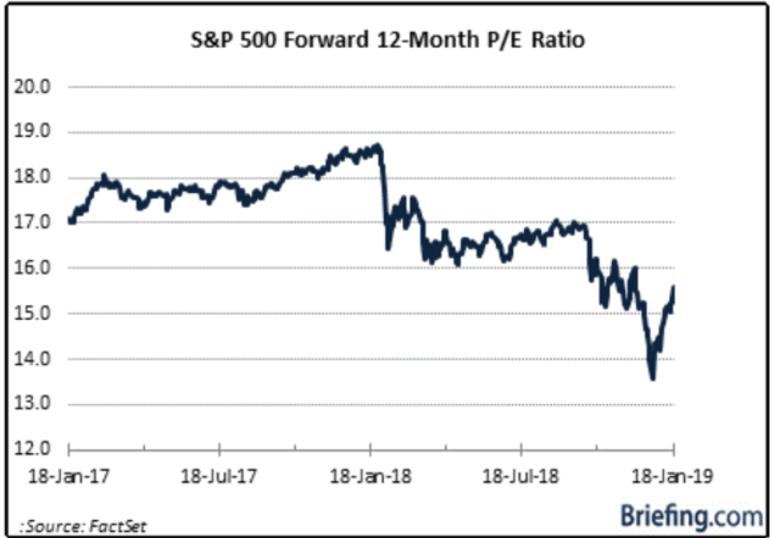
For my real-time estimate of where the market will finish the year I use a realistic range of forward PEs, from 15 to 17 (a range of 6% historically undervalued to 6% overvalued). The 16.0 historical forward PE is the most likely estimate since it’s based on fundamentals (decent earnings growth) and a reasonable market multiple.
- 15X forward earnings: S&P 500 closes 2019 at 2,855 = 7% gain from January 18th close
- 16x forward earnings (historical fair value): 3,045 = 14% gain
- 17X forward earnings: 3,235 = 21% gain from current levels
Thus based on the latest data and trends, investors can likely expect 2% or slightly faster economic growth and a stock market that finishes the year 7% to 21% higher than its January 18th close of 2,671 (most likely 14% so up about 20% for 2019).
But what about all the risk factors investors are so worried over? Well, indeed they should be because they threaten to derail both US economic growth in 2019 and the market rally that both current expectations and market history says is likely.
Wild Card Risks To Consider
The three biggest wildcards in 2019 are the trade negotiations with China, the government shutdown, and the debt ceiling debate we have coming this year. While Bloomberg is reporting that Trump is “eager to make a deal to boost the stock market” there is always a chance that he might reject the latest Chinese offer. Even if he accepts it (most likely in early February) and extends the negotiating deadline by 3 to 6 months to keep addressing the other key issues, negotiations might break down later this year.
That could mean that tariffs which might come down in early 2019 go up to 25% later in 2019. A decrease or elimination in tariffs would boost corporate earnings but a collapse of trade talks could trigger an outright earnings recession, and stocks would likely collapse, possibly back to December lows.
The government shutdown, according to the White House’s own economic estimates, is decreasing Q1’s GDP growth by about 0.1% per week and even if it ends today, will have reduced GDP growth by about 0.5% this quarter.
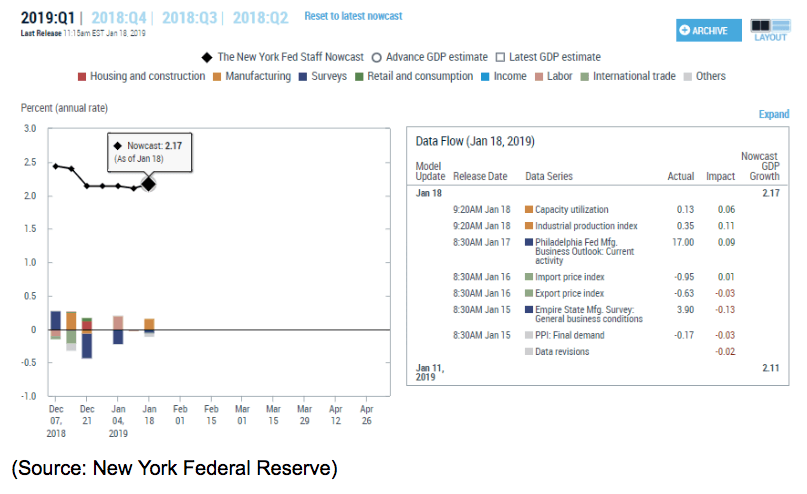
Given that the New York Fed’s latest estimate for Q1 growth is 2.2% that means we might be facing sub 2% growth this quarter. But it’s important to keep in mind that Q1 of any given year is typically the weakest one which means that as long as the shutdown ends soon we’re likely to see growth recover strongly in Q2 and Q3.
Of course, if the shutdown drags into February, March or even April, then we are facing rising 2019 recession risk that worsens by the day. That’s because not just are 800,000 government employees not getting paid (they get backpay when the shutdown ends), but 4 million government contractors are also missing paychecks (second one Friday, January 25th). Contractors do NOT get back pay. With the shutdown at 32 days and counting (with no end in sight), the economic damage is now permanent with various restaurants, hotels, and airlines reporting large decreases in revenues in recent weeks.
Which brings me into the final major economic risk of 2019, the debt ceiling, and how the shutdown possibly feeds into that. 90% of the IRS’s employees are currently furloughed and there’s already talk of pushing back 2019’s filing deadline. Tomorrow I’ll do an in-depth look at how American tax returns might end up making the negative economic effects of the shutdown exponentially worse in February and March. But in terms of the debt ceiling, here’s what you need to know.
10% of American workers are full-time freelancers/contractors, with another 20% working part-time in the gig economy. Most of the income taxes these workers pay is once per year, in April. If the shutdown lasts too long then the government could see hundreds of billions of expected tax revenue not appear, which pushes up the debt ceiling crisis clock from August to October (per Goldman Sachs) to possibly as early as May.
With our leaders unable to come to an agreement over just $5.7 billion for 200 miles of border fence, imagine what might happen when a possible US debt default (which would likely trigger a 2008-2009 style global financial crisis) is on the line.
Basically, IF (and that’s a big if) our leaders stop acting like children, then 2019 should see good economic growth and be a great year for stocks. But if the shutdown lasts all year, then a recession and bear market become certain and we face a real risk of a major financial crisis.
Bottom Line: Expect Slower But Still Positive Growth In 2019 To Drive Stocks Nicely Higher…Unless Our Leaders Screw Us All
The good news is that America’s economy came into 2019 on strong footing, with the best labor market in decades driving strong consumer confidence and spending. While that confidence has waned in recent months and is likely to dip further due to the longest government shutdown in history, we are most likely set for a year of close to 2% economic growth this year. Only major policy mistakes from our leaders, such as a US debt default or shutdown that lasts well into Q2 could derail our economy and cause us to fall into a recession this year.
What that means for stocks is that corporate earnings are likely to still grow this year, accelerating steadily with each passing quarter (due to steady progress on the trade war front unless those talks collapse). So while long-term forecasts must always be taken with a healthy grain of salt, for now the latest evidence points to the stock market closing the year up 7% to 21% from today’s levels and most likely delivering about 20% total returns in 2019.
While volatility is likely to remain high, long-term investors will want to avoid the temptation to “sit on the sidelines until the uncertainty lifts”. Remember that time in the markets is far more important than timing the market when it comes to building long-term wealth and dividend income. But also don’t forget that the short-term stupidity of our political leaders is infinite which means you need to protect your portfolio with the right mix of stocks/bonds/cash to avoid having to sell during any possible corrections/crashes that high political risk might cause.
About the Author: Adam Galas

Adam has spent years as a writer for The Motley Fool, Simply Safe Dividends, Seeking Alpha, and Dividend Sensei. His goal is to help people learn how to harness the power of dividend growth investing. Learn more about Adam’s background, along with links to his most recent articles. More...
9 "Must Own" Growth Stocks For 2019
Get Free Updates
Join thousands of investors who get the latest news, insights and top rated picks from StockNews.com!

