
Rave Restaurant Group, Inc. (RAVE): Price and Financial Metrics
RAVE Price/Volume Stats
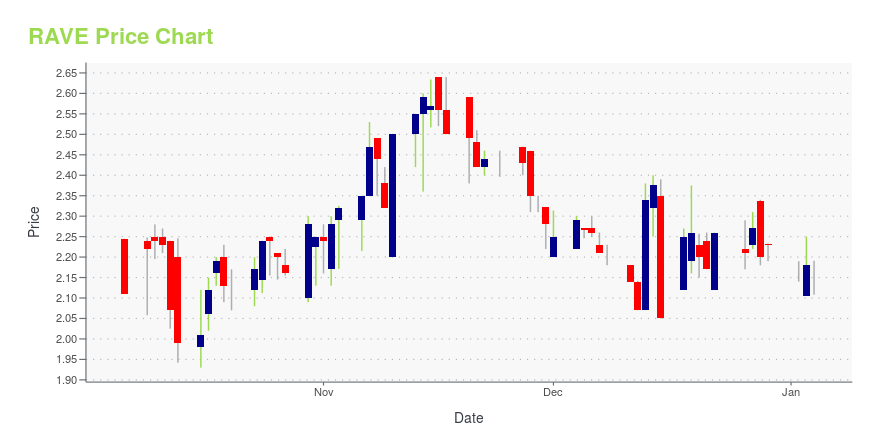
| Current price | $1.97 | 52-week high | $2.64 |
| Prev. close | $2.08 | 52-week low | $1.50 |
| Day low | $1.95 | Volume | 33,200 |
| Day high | $2.09 | Avg. volume | 33,229 |
| 50-day MA | $2.00 | Dividend yield | N/A |
| 200-day MA | $2.10 | Market Cap | 28.74M |
RAVE Stock Price Chart Interactive Chart >
Rave Restaurant Group, Inc. (RAVE) Company Bio
Rave Restaurant Group, Inc. franchises and distributes food to a chain of pizza buffet, delivery/carry out and express restaurants. The Company operates restaurants in the United States and other countries around the world.
Latest RAVE News From Around the Web
Below are the latest news stories about RAVE RESTAURANT GROUP INC that investors may wish to consider to help them evaluate RAVE as an investment opportunity.
We Think Some Shareholders May Hesitate To Increase Rave Restaurant Group, Inc.'s (NASDAQ:RAVE) CEO CompensationKey Insights Rave Restaurant Group to hold its Annual General Meeting on 5th of December Salary of US$350.0k is part of... |
Just in Time for Thanksgiving, Pizza Inn Introduces 'The Gobbler' PizzaDALLAS, TX / ACCESSWIRE / November 3, 2023 / Giving Americans another reason to count their blessings this time of year, Pizza Inn has added a unique new Thanksgiving-themed pizza, called "The Gobbler," to its ever-popular and extensive array of buffet ... |
Rave Restaurant Group Inc (RAVE) Reports Increased Net Income in Q1 Fiscal 2024RAVE's Q1 earnings show a 25.7% increase in net income year-over-year |
RAVE Restaurant Group, Inc. Reports First Quarter ResultsDALLAS, TX / ACCESSWIRE / November 2, 2023 / RAVE Restaurant Group, Inc. (NASDAQ:RAVE) today reported financial results for the first quarter of fiscal 2024 ended September 24, 2023.RAVE Restaurant Group RAVE Restaurant Group LogoFirst Quarter Highlights:Total ... |
Rave Restaurant Group (NASDAQ:RAVE) Shareholders Will Want The ROCE Trajectory To ContinueIf we want to find a stock that could multiply over the long term, what are the underlying trends we should look for... |
RAVE Price Returns
| 1-mo | -7.51% |
| 3-mo | -0.51% |
| 6-mo | -16.17% |
| 1-year | 26.29% |
| 3-year | 55.12% |
| 5-year | -1.50% |
| YTD | -11.66% |
| 2023 | 41.14% |
| 2022 | 56.44% |
| 2021 | 10.98% |
| 2020 | -44.84% |
| 2019 | 87.50% |
Continue Researching RAVE
Here are a few links from around the web to help you further your research on Rave Restaurant Group Inc's stock as an investment opportunity:Rave Restaurant Group Inc (RAVE) Stock Price | Nasdaq
Rave Restaurant Group Inc (RAVE) Stock Quote, History and News - Yahoo Finance
Rave Restaurant Group Inc (RAVE) Stock Price and Basic Information | MarketWatch
Loading social stream, please wait...