Markets tried to rally Friday as stocks pivoted off the lows to close virtually unchanged on the day. Some of the late day move was likely option related given it was May option expiration. On the week, however, the Dow Jones Industrials (DIA) fell nearly 3%, even given the late day rally. This marked 8 straight down weeks in a row for the DIA-the longest such losing streak since 1923 (almost 100 years ago!). At some point a sharp counter-trend rally is likely in the offing.
Trying to pick an exact bottom is difficult in any market environment, but even a tougher task now. The one thing for certain is that as stocks continue to fall week after week, they are getting closer to the ultimate low. So far it has been wise to be wait to be a buyer given that stocks are at back trading at the lowest levels in the past year.
The price action seen on Friday in the DIA was encouraging as mentioned earlier. Shares opened lower once again and fell over 1% before reversing course to finish back at the highs of the day and down just 14 cents. This type of price action is many times emblematic of a reversal pattern beginning to emerge. The sellers may finally be exhausted, and the buyers have taken control. It is even more powerful given the magnitude of the prior sell-off.
Caution is still warranted, however. Lower beta value stocks are still favored over higher beta growth names in this market environment. DIA is my favorite broad-based stock ETF given my more cautious approach.
The DIA, or Diamonds as they are called, differ from most other indices and ETFs since it is price weighted. Almost all other indices and ETFs are market cap weighted. For the Diamonds, higher priced stocks have a more material impact on the overall price of the ETF than lower priced stocks. The weightings below show how United Health has a larger weighting than Apple-even though Apple is the biggest market cap stock in the U.S. Also note how DIA is only thirty stocks and has a decidedly more value-based group of component stocks compared to the S&P 500 (SPY) or the NASDAQ 100 (QQQ).
| Name | Ticker | Weight |
| UnitedHealth Group Incorporated | UNH | 10.087098 |
| Goldman Sachs Group Inc. | GS | 6.496383 |
| Home Depot Inc. | HD | 6.065539 |
| Microsoft Corporation | MSFT | 5.335802 |
| Amgen Inc. | AMGN | 5.159376 |
| McDonald’s Corporation | MCD | 4.826968 |
| Caterpillar Inc. | CAT | 4.358183 |
| Visa Inc. Class A | V | 4.160256 |
| Honeywell International Inc. | HON | 4.060766 |
| Johnson & Johnson | JNJ | 3.666388 |
| Travelers Companies Inc. | TRV | 3.568584 |
| Chevron Corporation | CVX | 3.517152 |
| Salesforce Inc. | CRM | 3.279809 |
| American Express Company | AXP | 3.246083 |
| 3M Company | MMM | 3.097691 |
| Procter & Gamble Company | PG | 2.986818 |
| Apple Inc. | AAPL | 2.895127 |
| International Business Machines Corporation | IBM | 2.733033 |
| Boeing Company | BA | 2.679916 |
| Walmart Inc. | WMT | 2.509813 |
| JPMorgan Chase & Co. | JPM | 2.493793 |
| NIKE Inc. Class B | NKE | 2.243592 |
| Walt Disney Company | DIS | 2.174033 |
| Merck & Co. Inc. | MRK | 1.941116 |
| Dow Inc. | DOW | 1.449355 |
| Coca-Cola Company | KO | 1.264708 |
| Verizon Communications Inc. | VZ | 1.034953 |
| Intel Corporation | INTC | 0.885506 |
| Cisco Systems Inc. | CSCO | 0.879394 |
| Walgreens Boots Alliance Inc | WBA | 0.855996 |
|
|
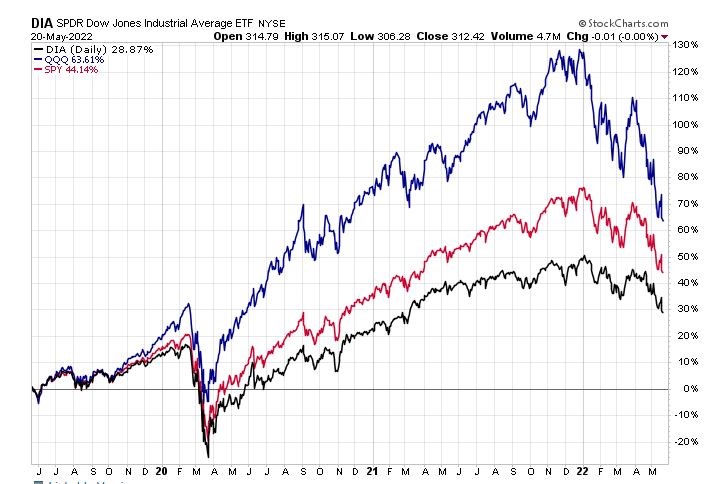
2022 will likely be the year that value stocks finally out-perform growth given the rising rate environment. Already beginning to see that performance gap close, but it still has a long way to go as the chart below shows. Prefer to look to be a buyer of the lower beta stocks that comprise the DIA rather than the riskier names in the S&P 500 (SPY) or NASDAQ 100 (QQQ) as the gap closes even further.
Most of you are probably very familiar with the VIX. It is the most widely followed measure of implied volatility (IV). It is based on the price of 30-day S&P 500 option prices. In a similar vein the 30-day implied volatility of the DIA is shown below over the past year. A price chart of the DIA for that same period is also shown right below the IV chart.
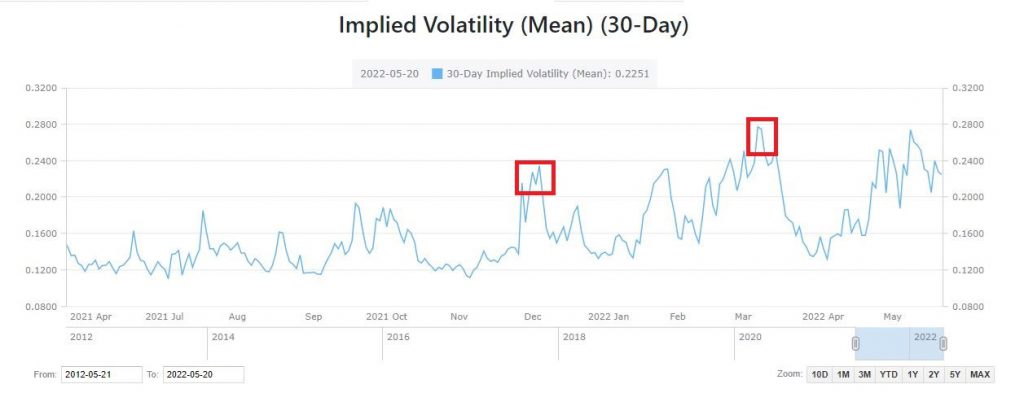

Note how times when the IV spikes to an extreme normally indicates a short-term low in the DIA. The last two times the IV in DIA more than doubled off the prior lows proved to be good times to take a short-term bullish stance. The most recent spike in IV was once again 100% higher than the previous low. If history holds this should be a tradeable bottom for the Dow.
Important to remember that implied volatility (IV) is just a fancy way to say the price of the options. Higher levels of implied volatility mean option prices are more expensive. It also means you can get the same price by selling a similar put but have a much bigger margin of safety.
Going to use the standard deviation calculator we developed a while back to show how higher IV effects option prices. It may look complex on the surface, at least initially, but don’t need to be a mathematician to understand it.
Standard deviation is a unit of measurement that equates to probabilities. One standard deviation means that there is a 68% likelihood (one standard deviation) that DIA will go up or down less than that amount in the given time frame.
32% of the time it will move more than that amount. Half the time (16% likelihood) it will be higher and half the time (the same 16% likelihood) it will be lower than one standard deviation. Math lesson over.
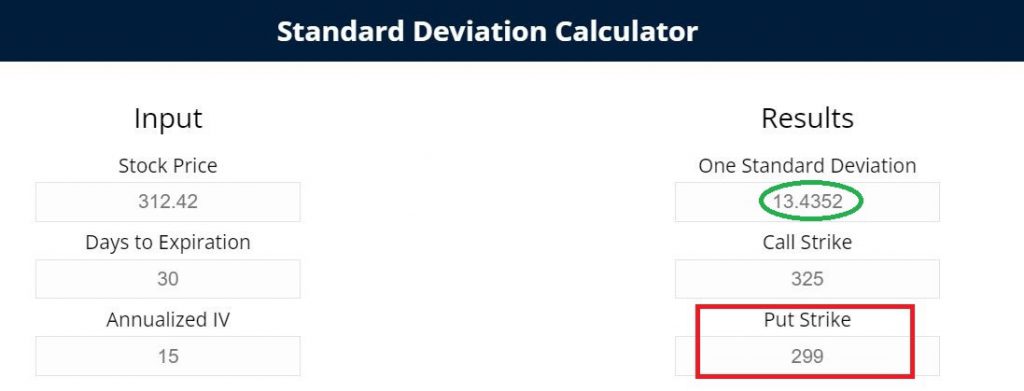
For example, let’s look at DIA at the price it closed Friday ($312.42) and thirty days to expiration. If IV was at 15, one standard deviation would equate to 13.44. The $299 put would then be one standard deviation out-of-the money or 4.3% lower than the $312.42 closing price of DIA. So only a 16% chance that DIA will be lower than $299 30 days from now.
Now let’s look at the same scenario except that IV is now 22.50 instead of 15. I used these two IV levels since 15 is recent average IV and 22.50 is about where it is now.
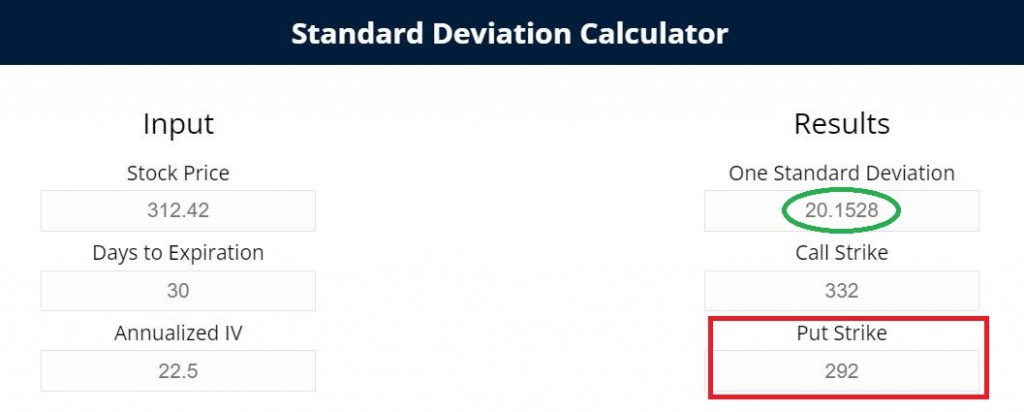
One standard deviation at 22.50 IV equates to 20.15, a big jump from the 13.44 when IV was at 15. This means a one standard deviation out-of-the-money put would be 7 points lower (6.5%) at $292. A 2.2% bigger downside cushion for the same price due to the higher level of IV. So, the same 16% chance that DIA will be lower in 30 days, but now that level is $292 instead of the previous $299.
The combination of cheaper stock prices and more expensive option prices sets up ideally for a put selling strategy. You get paid up front for the obligation to potentially be a buyer at lower levels.
Currently the DIA June 24 $290 put is trading around $2.75. It has 32 days until expiration and is a little more than one standard deviation out-of-the-money.
Selling one of these puts will bring in $275 now and obligate the seller of the put to be a buyer of the DIA if it closes below $290 on June 24 expiration and you get assigned DIA shares. The net price you would buy the DIA at is $287.25 ($290 strike price less $2.75 premium received) if you were assigned on the puts.
Of course, you can always buy back the puts you sold at any time prior to expiration to close out the trade.
More risk adverse traders may want to consider selling defined risk option spreads instead of naked puts. Both the risk and margin requirements are lower. For example, selling the June 24 $290 put and then simultaneously buying the June 24 $285 put for protection would bring in a net credit of 60 cents or $60 per spread. Maximum gain on the trade is initial net credit received of $60 per spread. Maximum risk is $440 per spread. Return on risk is 13.63%.
Investors and traders alike should seriously consider selling puts or put spreads to take advantage of much cheaper stocks and much more expensive options. By doing so, you get paid for your patience with a more attractive entry point.
What To Do Next?
If you’re looking for the best options trades for today’s market, you should check out our POWR Options Newsletter
which launched in November and is already off to a fantastic start.
What is the secret to success?
This unique service harnesses the solid foundation of the POWR Ratings to find the best
options trades, helping you to enjoy higher gains with lower risk.
If you would like to see the current portfolio of options and be alerted to our next timely trades,
then consider starting a 30 day trial by clicking the link below:
About POWR Options & 30 Day Trial
All the best,
Tim Biggam
Want More Great Investing Ideas?
DIA shares closed at $312.42 on Friday, down $-0.76 (-0.24%). Year-to-date, DIA has declined -13.59%, versus a -17.71% rise in the benchmark S&P 500 index during the same period.
About the Author: Tim Biggam

Tim spent 13 years as Chief Options Strategist at Man Securities in Chicago, 4 years as Lead Options Strategist at ThinkorSwim and 3 years as a Market Maker for First Options in Chicago. He makes regular appearances on Bloomberg TV and is a weekly contributor to the TD Ameritrade Network "Morning Trade Live". His overriding passion is to make the complex world of options more understandable and therefore more useful to the everyday trader. Tim is the editor of the POWR Options newsletter. Learn more about Tim's background, along with links to his most recent articles. More...
More Resources for the Stocks in this Article
| Ticker | POWR Rating | Industry Rank | Rank in Industry |
| DIA | Get Rating | Get Rating | Get Rating |
| QQQ | Get Rating | Get Rating | Get Rating |
| SPY | Get Rating | Get Rating | Get Rating |


