

Investors in the precious metals space have had to endure a painful 12-month stretch, with gold (GLD) down 18%, silver (SLV), and many miners down as much as 45% in the same period. This pathetic performance has been even more frustrating considering the backdrop of inflation readings at multi-year highs and ultra-loose monetary policy. However, while we have seen significant damage to the short-term charts for gold and silver during this lengthy correction, the long-term charts remain bullish, with minimal technical damage.
Most importantly, one key ratio continues to point to this being a correction within a bull market vs. a new bear market. For investors looking to buy the dip, one of the most attractive names looks to be GoGold Resources (GLGDF). Let’s take a closer look below:
With sentiment in the toilet and many investors disgusted with their precious metals holdings and some leaving the space altogether, it’s not surprising that we’re now hearing lots of chatter about Q3 2020 being the peak for metals and that we’re starting a new bear market. However, one look at the Silver/Gold ratio suggests differently, given that it’s acting completely different from the last bull market peak. As shown below, the 2011 peak saw the price of gold race to new highs in Q2 and early Q3, while silver was unable to make a new high, sending the Silver/Gold ratio plunging from a reading of 0.30 to 0.22. This significant underperformance in silver is never a good sign, and it suggested that we were likely at the tail end of a bull market, with the ratio making a lower high and a lower low just as gold made its new highs above $1,900/oz.

(Source: TC2000.com)
If we look at the current case, we have a totally different setup, with the Silver/Gold ratio trading in a brutal bear market for nearly a decade but reclaiming its key moving average and making higher highs and higher lows since last summer. The Silver/Gold ratio’s most recent high was made after the August 2020 peak in gold prices, and silver also made a marginal new high in February 2021. These are two things that did not occur in the April 2011 to August 2011 period before gold peaked. So, while we have seen some weakness in this indicator with a marginally lower high, we still remain above the monthly moving average (white line) and have yet to make a lower low. This medium-term outperformance suggests that this bull market is still alive and well and could be in its infancy, with new highs for gold above $2,050/oz coming within the next year. Of course, this is contingent on the Silver/Gold ratio not making a lower low at the 0.118 area. We are currently just above 0.13.
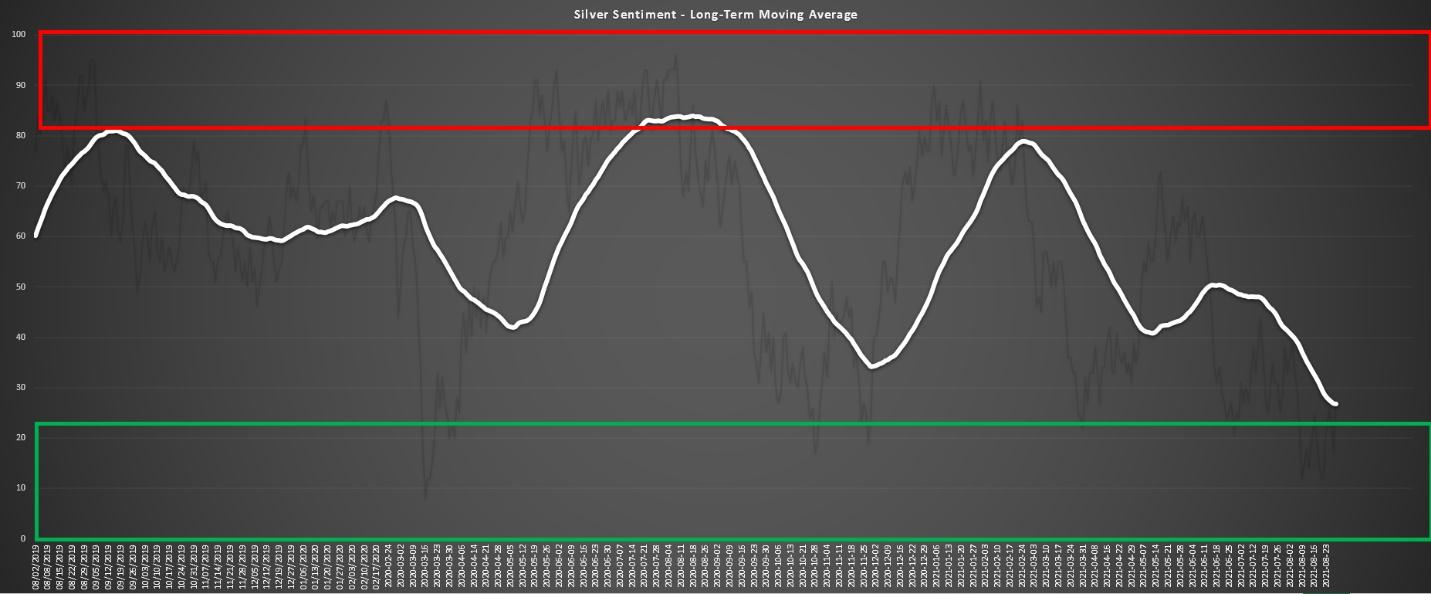
(Source: Daily Sentiment Index Data, Author’s Chart)
Some investors might argue that this ratio could continue to drop given that it’s trending lower on a short-term basis and that a break of the moving average is imminent. While anything is possible, the odds favor this indicator bottoming out soon, given that we have sentiment readings for silver sitting at their most pessimistic levels in over two years. These readings could head lower and there’s no guarantee history rhymes, but we have typically seen 20% plus 6-month forward returns from readings below 35% in the past. So, with this indicator currently sitting just outside the extreme pessimism zone, I would argue that the path of least resistance is now higher for silver, with so many having given up on the trade. This suggests that silver should begin to outperform gold and that the Silver/Gold ratio will hold up and remain above its key monthly moving average.
So, what’s the best course of action?

(Source: TC2000.com)
With strong support at $22.00/oz for silver and strong resistance at $26.35/oz, I plan to start positions in silver if it heads back near the $22.65/oz level to re-test its recent low. At this level, the metal would offer a more than 6/1 reward to risk ratio to resistance at $26.35 vs. support just 3% lower. As long as this support level holds, I see no reason to question the fact that silver is in a bull market, given that this area lines up with the metal’s breakout last summer to new multi-year highs. This makes the optimal trading strategy buying at $22.65/oz or lower and taking profits above $25.50/oz towards resistance.
However, the superior way to play silver, in my view, is GoGold Resources. This is because this junior has made two major discoveries in the past year in Mexico, has a business model that allows it to fund most of its development/drilling work with free cash flow from its small Parral Mine. This helps GoGold continue to build on its recent discoveries without additional share dilution. Most importantly, though, GoGold is much stronger than silver on a technical basis, making a new all-time high this year with the stock continuing to outperform. The below chart is evidence of this, with GoGold making another new high vs. silver during its correction and successively higher lows. So, while I would consider silver at $20.65/oz or lower for a trade, GoGold Resources is likely to outperform over the short-term and medium-term, given that it’s held up extremely well even during silver’s 26% correction.
Disclosure: I am long GLD, GLGDF
Disclaimer: Taylor Dart is not a Registered Investment Advisor or Financial Planner. This writing is for informational purposes only. It does not constitute an offer to sell, a solicitation to buy, or a recommendation regarding any securities transaction. The information contained in this writing should not be construed as financial or investment advice on any subject matter. Taylor Dart expressly disclaims all liability in respect to actions taken based on any or all of the information on this writing.
Want More Great Investing Ideas?
SLV shares were trading at $22.27 per share on Tuesday morning, up $0.01 (+0.04%). Year-to-date, SLV has declined -9.36%, versus a 21.53% rise in the benchmark S&P 500 index during the same period.
About the Author: Taylor Dart

Taylor has over a decade of investing experience, with a special focus on the precious metals sector. In addition to working with ETFDailyNews, he is a prominent writer on Seeking Alpha. Learn more about Taylor’s background, along with links to his most recent articles. More...
More Resources for the Stocks in this Article
| Ticker | POWR Rating | Industry Rank | Rank in Industry |
| SLV | Get Rating | Get Rating | Get Rating |
| GLD | Get Rating | Get Rating | Get Rating |


