
It’s been an impressive first half of Q4 thus far for the precious metals complex, with silver (SLV) leading the way, up 12% for the quarter, tacking another 4% in November alone. This solid performance has helped the metal claw back some of its year-to-date losses, with SLV now down ~6% for the year vs. nearly 20% decline at its October lows. The recent outperformance has also helped silver to reclaim its key weekly moving average relative to the S&P-500 (SPY), with the Silver/S&P-500 ratio looking like it may have just made a double bottom. Between a backdrop of negative real rates, and violent underperformance over the past nine months for silver, the ingredients are in place for a very strong year in 2022. Let’s take a closer look below:
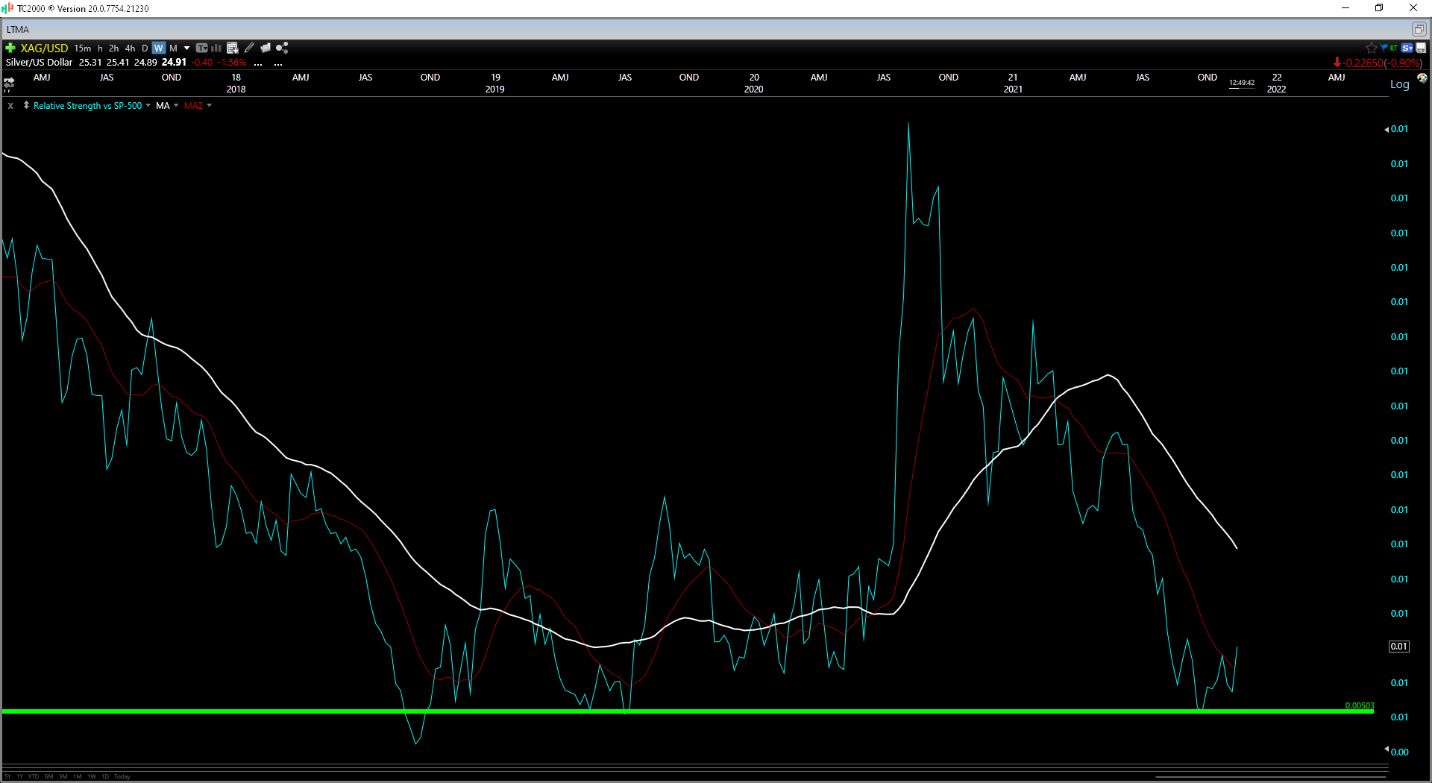
(Source: TC2000.com)
As the chart above shows, silver has been in a steep downtrend over the past year vs. the S&P-500 but recently found some support at a major support level. This is the same level where this ratio bottomed in late 2018. Since attempting to hammer out a bottom, the Silver/S&P-500 ratio has climbed back above its short-term moving average (red line), a positive sign suggesting a potential change in momentum. If we look back over the past three decades, silver’s best performance has come when it’s only been leading the price of gold but also the S&P-500, and this recent shift in momentum is a positive development thus far. The key to confirming this, though, is for the Silver/S&P-500 ratio to move above its long-term trend line as well, which would require a dip in the S&P-500/Silver ratio to 170 or lower. This will be a level to monitor as we head into the back half of Q4.
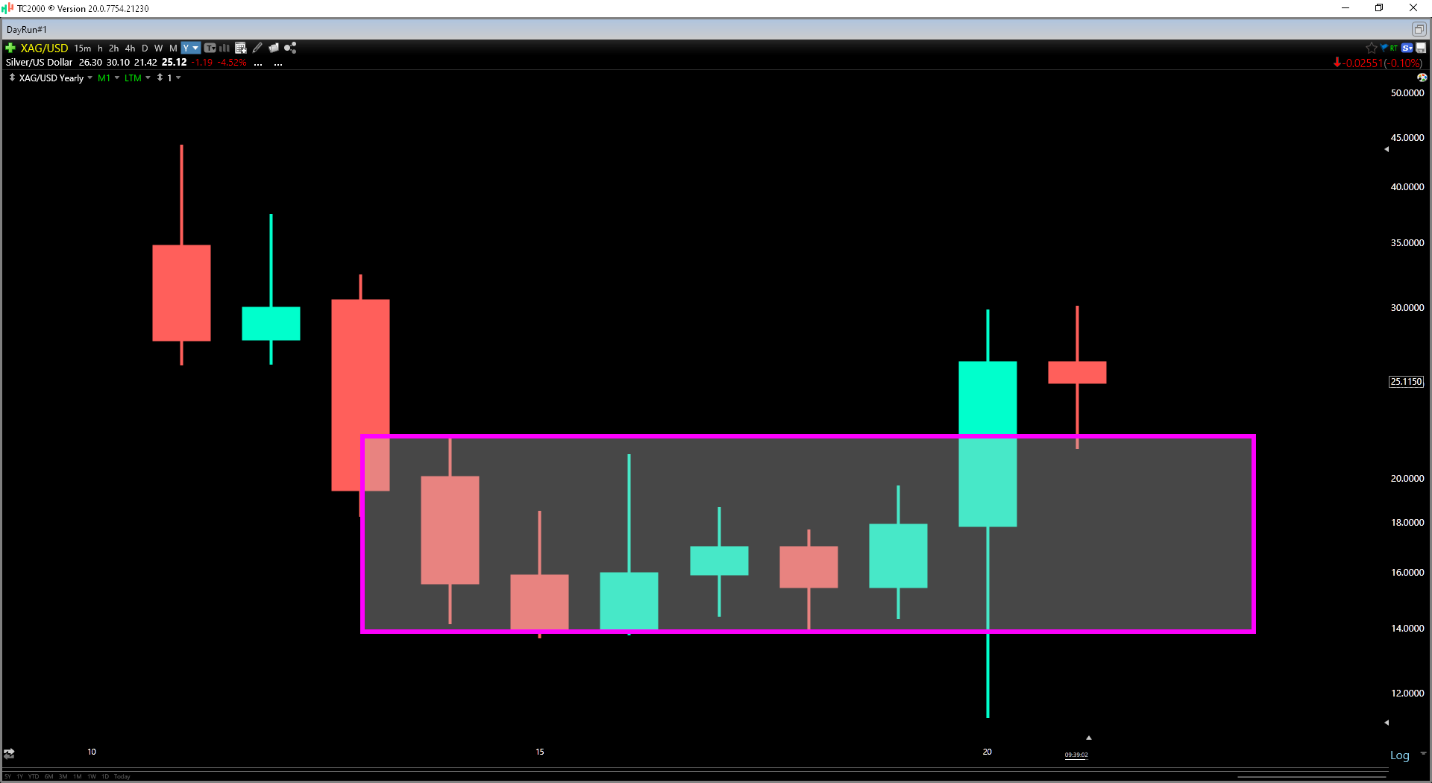
(Source: TC2000.com)
If we take a look at silver’s technical picture, it’s important to note that this recent outperformance relative to the S&P-500 is corroborated by a very attractive looking chart. As shown above, silver has broken out of a massive multi-year base, re-tested the top of this base, and is now trading well above the level of its back-test. Generally, multi-year breakouts are very bullish developments, and silver is one of the only assets, including gold (GLD), that has seen a 5+ year range breakout in the past couple of years. There is no guarantee that this base-on-base breakout resolves to the upside, but as long as silver can stay above $22.00/oz, the odds remain high that the metal will move above the $31.00/oz level within the next 15 months.
So, what’s the best course of action?

(Source: Daily Sentiment Index Data, Author’s Chart, www.trade-futures.com)
Moving over to a chart of sentiment above, we can see that silver sentiment has shot higher over the past three weeks and finished Monday at 65% bulls. This is a somewhat elevated reading short-term, with bullish sentiment sitting below 20% just over three weeks ago. The elevated reading doesn’t mean that the silver price has to decline, but it does increase the probability of a shakeout or pullback. For this reason, I believe it’s best to look at buying silver on a dip and waiting for a pullback closer to the $23.50/oz level, where silver has a strong support zone. This area lines up with its short-term uptrend line, as well as a re-test zone of its recent downtrend line breakout.
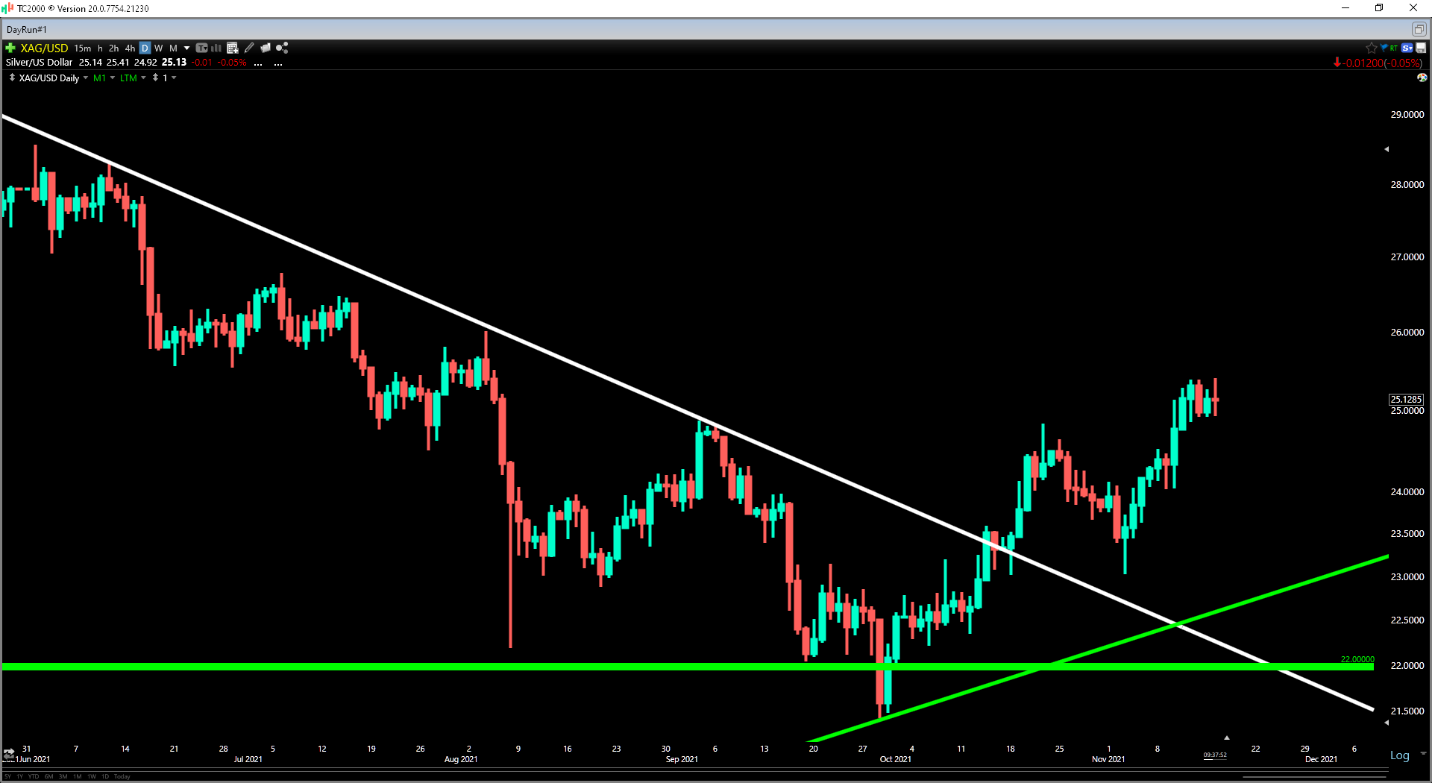
(Source: TC2000.com)
While Bitcoin (GBTC), the Nasdaq-100 (QQQ), and many growth names continue to get all the attention, silver is quietly beginning to outperform the general market and is sporting one of the best looking long-term charts among the 150+ ETFs I track. With long-term sentiment appearing to have capitulated last month, it looks like we could be in the early innings of a new bull market for silver, which means that any 12% pullbacks in the metal should present low-risk buying opportunities. In summary, I believe investors should keep a close eye on the silver price, given that pullbacks below $23.50/oz should provide low-risk entry points into the metal. Given the impressive long-term chart, I would not be surprised to see silver above $29.00/oz in the next 12 months.
Disclosure: I am long GLD
Disclaimer: Taylor Dart is not a Registered Investment Advisor or Financial Planner. This writing is for informational purposes only. It does not constitute an offer to sell, a solicitation to buy, or a recommendation regarding any securities transaction. The information contained in this writing should not be construed as financial or investment advice on any subject matter. Taylor Dart expressly disclaims all liability in respect to actions taken based on any or all of the information on this writing.
Want More Great Investing Ideas?
SLV shares were trading at $22.96 per share on Tuesday afternoon, down $0.28 (-1.20%). Year-to-date, SLV has declined -6.55%, versus a 26.86% rise in the benchmark S&P 500 index during the same period.
About the Author: Taylor Dart

Taylor has over a decade of investing experience, with a special focus on the precious metals sector. In addition to working with ETFDailyNews, he is a prominent writer on Seeking Alpha. Learn more about Taylor’s background, along with links to his most recent articles. More...
More Resources for the Stocks in this Article
| Ticker | POWR Rating | Industry Rank | Rank in Industry |
| SLV | Get Rating | Get Rating | Get Rating |


