

“Be Fearful When Others Are Greedy And Greedy When Others Are Fearful” is a famous stock market adage of famed investor Warren Buffet. The CNN Fear and Greed Index certainly epitomizes that notion. The chart below shows how greed and fear tend to swing back and forth from one extreme to the other.
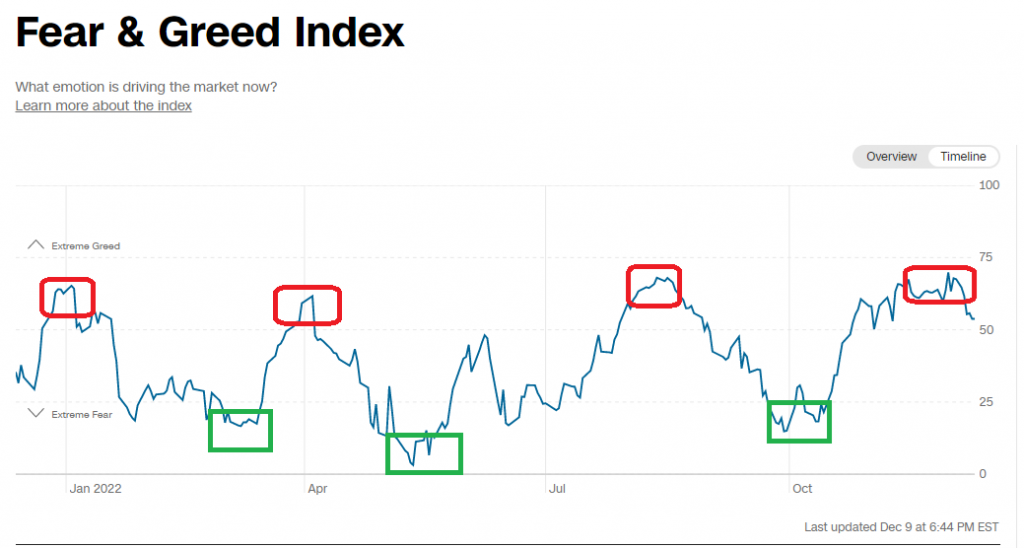
Following in the footsteps of Mr. Buffet is never a bad decision, in my opinion. Getting greedy when others are fearful and fearful when others are greedy has worked well in 2022. Adding in a few other tried and true methodologies to that philosophy can make it even more robust. Here are three more ways to increase the odds of success in trading.
Technicals
The chart below shows the one-year price action for the S&P 500 (SPX). It is evident that the SPX continues to be in a well-defined downtrend, with a series of lower highs and lower lows. Indeed, the recent strong rally we saw off the lows ended right at the trend line before beginning to reverse course.
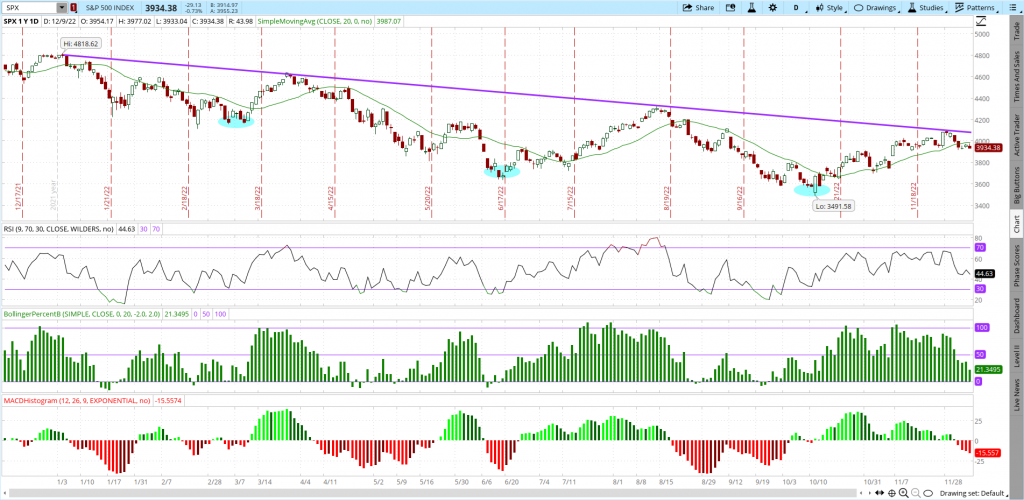
How far the current pullback will go is anyone’s best guess. However, if previous history is any guide, then $3400 would be a good guess.
I pulled off the numbers from the prior three times the SPX fell from the downtrend line before bottoming out and heading back up, as seen in the table below.
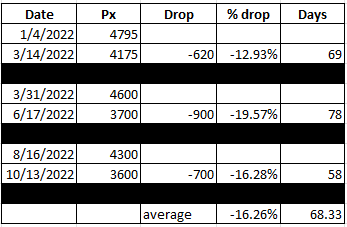
The average of the three drops so far this year has been just over 16% and took roughly a little over two months. That would equate to a drop that ends up around $3400 in the S&P 500 by about February option expiration on 2/17/2023-if the averages hold.
Seasonality
Certainly, many are still waiting for the so-called “Santa Claus Rally” to take stocks higher on a seasonal basis into Christmas. Given the red-hot rally since October, Santa may have already come early for the markets. But seasonality is a two-edged sword. Once Kris Kringle leaves town, stocks tend to suffer.
January has been the worst performing month for stocks over the past two decades. The S&P 500 has shown an average loss of 0.5% in that time frame and has dropped 55% of the time. February has been a laggard as well.
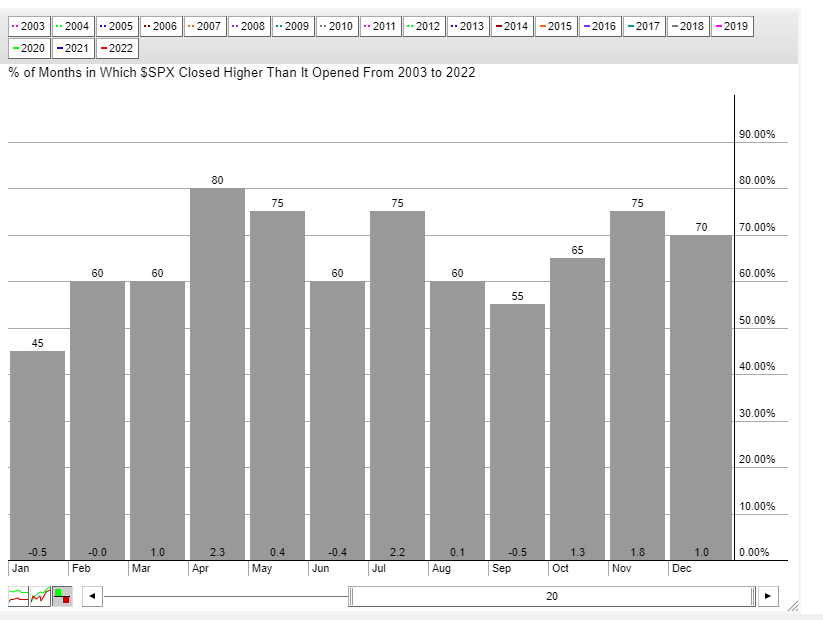
Stocks may have trouble finding their footing until springtime if seasonality is any guide.
The VIX
The VIX is a measure of 30-day implied volatility in the S&P 500 options. It is also referred to as the fear gauge since it tends to rise when stocks drop and fall when stocks rally. I recently wrote an article that showed how you can use the VIX to time the market.
The chart below shows just how pops and drops in the VIX have corresponded almost precisely to similar drops and pops in the S&P 500. Also note how the VIX extremes correspond to the CNN Fear and Greed Index extremes noted at the start of this article.
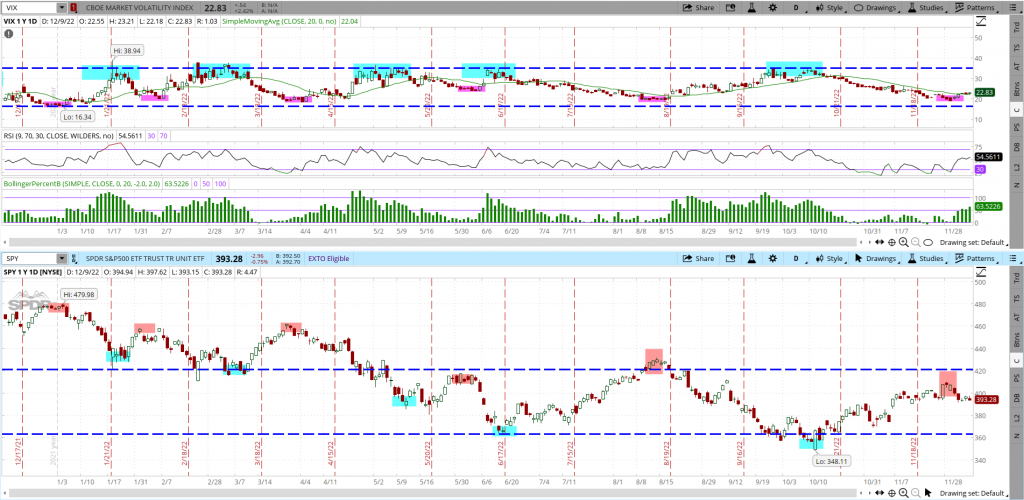
The latest fall in the VIX from highs at 34 to the recent lows under 20, followed by a subsequent rally to nearly 23, generated another VIX-based sell signal for stocks. Each of the previous moves off the lows in the VIX ended up finally stalling at the 34 area. If history holds, the VIX has much further to head higher-and stocks have much further to fall.
As you can see in the chart, each new VIX-based Buy signal corresponded with a new low in the SPY, which is the S&P 500 ETF.
Everything being equal, stocks may not bottom out and be a buy until they make new lows on the year.
Trading is all about probability, not certainty. Using these three measures discussed in your decision making will help put probabilities-and therefore the odds- in your favor.
POWR Options
What To Do Next?
If you’re looking for the best options trades for today’s market, you should check out our latest presentation How to Trade Options with the POWR Ratings. Here we show you how to consistently find the top options trades, while minimizing risk.
If that appeals to you, and you want to learn more about this powerful new options strategy, then click below to get access to this timely investment presentation now:
How to Trade Options with the POWR Ratings
All the Best!
Tim Biggam
Editor, POWR Options Newsletter
Want More Great Investing Ideas?
SPY shares closed at $393.28 on Friday, down $-2.96 (-0.75%). Year-to-date, SPY has declined -16.24%, versus a % rise in the benchmark S&P 500 index during the same period.
About the Author: Tim Biggam
Tim spent 13 years as Chief Options Strategist at Man Securities in Chicago, 4 years as Lead Options Strategist at ThinkorSwim and 3 years as a Market Maker for First Options in Chicago. He makes regular appearances on Bloomberg TV and is a weekly contributor to the TD Ameritrade Network "Morning Trade Live". His overriding passion is to make the complex world of options more understandable and therefore more useful to the everyday trader. Tim is the editor of the POWR Options newsletter. Learn more about Tim's background, along with links to his most recent articles. More...
More Resources for the Stocks in this Article
| Ticker | POWR Rating | Industry Rank | Rank in Industry |
| SPY | Get Rating | Get Rating | Get Rating |


