

Zillow Group (Z - Get Rating) is approaching a support level that was formed over the past few months. If this level is breached, a breakdown is expected.
Z is an Internet-based real estate company that has historically focused on deriving ad revenue from third-party brokers on online marketplaces such as Zillow.com, Trulia, and HotPads.
Z has been benefiting from higher demand for residential real estate. The company has enabled home buying and selling in 25 different markets through its Zillow Offers service. Strong interest for this service is driving performance in its Homes segment. The company is also boosting its audience size during the pandemic through 3D virtual tours and consultations.
The company has a strong balance sheet with $3.9 billion in cash, compared with $670 million in short-term debt. Though its profitability measures are negative. Revenue growth has been strong over the past year, up 21.8%, but sales are forecasted to be down in the current quarter.
Its stock has a very high forward P/E of 181.82, which is concerning as its performance has been bearish down over the past month. These factors have resulted in a Sell Rating in our POWR Ratings system.
Take a look at the 1-year chart of Z below with added notations:
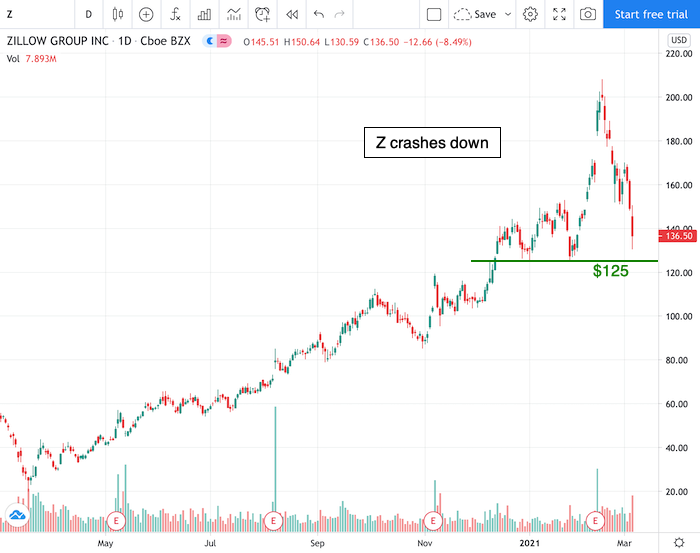
Z has created a key level of support at the $125 (green) mark over the past couple of months. The stock is seemingly on its way back down to that $125 level again. If the support level were to break, lower prices will likely follow for Z.
A trader could enter a short position if the stock were to break below the $125 support level.
Want to Discover More Great Trades?
I have explored virtually every flavor of technical analysis and chart pattern known to mankind. The sad fact is that the vast majority of them don’t work at all.
That is why I recently put together this special report to help investors focus on the only 5 chart patterns that matter…the ones that lead to the most timely and profitable stock trades. Click below to get your copy now!
5 WINNING Stock Chart Patterns
Have a good trading day!
Good luck!
Christian Tharp, CMT
Z shares fell $136.50 (-100.00%) in premarket trading Friday. Year-to-date, Z has gained 6.85%, versus a 1.81% rise in the benchmark S&P 500 index during the same period.
About the Author: Christian Tharp

I am an expert stock market coach having helped over 4000 beginner and advanced traders & investors from around the world take control of their financial futures. I also write stock market related articles for the Adam Mesh Trading Group and Yolo Publishing. More...
More Resources for the Stocks in this Article
| Ticker | POWR Rating | Industry Rank | Rank in Industry |
| Z | Get Rating | Get Rating | Get Rating |


