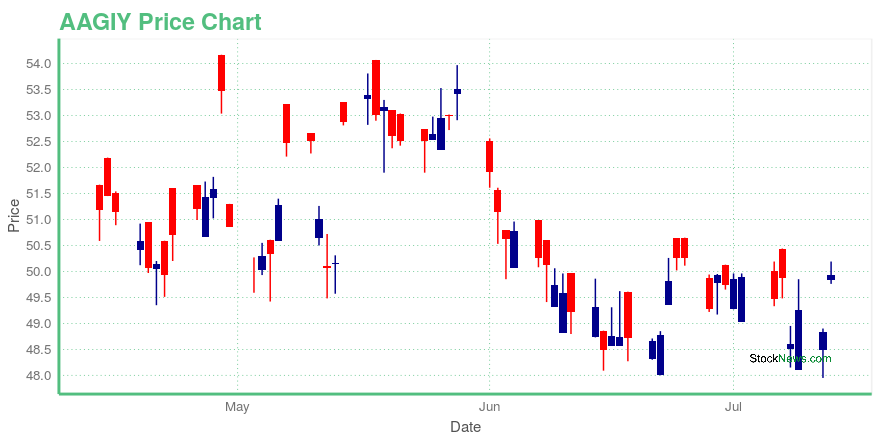
AIA Group Limited (AAGIY): Price and Financial Metrics
AAGIY Price/Volume Stats
| Current price | $28.53 | 52-week high | $38.44 |
| Prev. close | $28.91 | 52-week low | $25.00 |
| Day low | $28.30 | Volume | 92,599 |
| Day high | $28.54 | Avg. volume | 555,635 |
| 50-day MA | $29.85 | Dividend yield | 1.4% |
| 200-day MA | $29.45 | Market Cap | 76.27B |
AAGIY Stock Price Chart Interactive Chart >
AIA Group Limited (AAGIY) Company Bio
AIA Group Limited, together with its subsidiaries, provides insurance products and services. The company offers life, medical, accident protection, critical illness protection, and disability income protection insurance products, as well as savings plans for individuals; and employee benefit, Asia benefits network, credit insurance, and retirement solutions for businesses. It also distributes investment and other financial services products. The company distributes its products and services through agents; distribution partners; other intermediated channels, including independent financial advisers, brokers, private banks, and specialist advisers; and direct channel.
AAGIY Price Returns
| 1-mo | -6.03% |
| 3-mo | 1.31% |
| 6-mo | -11.71% |
| 1-year | 11.22% |
| 3-year | -19.59% |
| 5-year | -13.50% |
| YTD | -1.01% |
| 2024 | -14.71% |
| 2023 | -20.47% |
| 2022 | 12.16% |
| 2021 | -16.86% |
| 2020 | 18.65% |
AAGIY Dividends
| Ex-Dividend Date | Type | Payout Amount | Change | ||||||
|---|---|---|---|---|---|---|---|---|---|
| Loading, please wait... | |||||||||


Loading social stream, please wait...