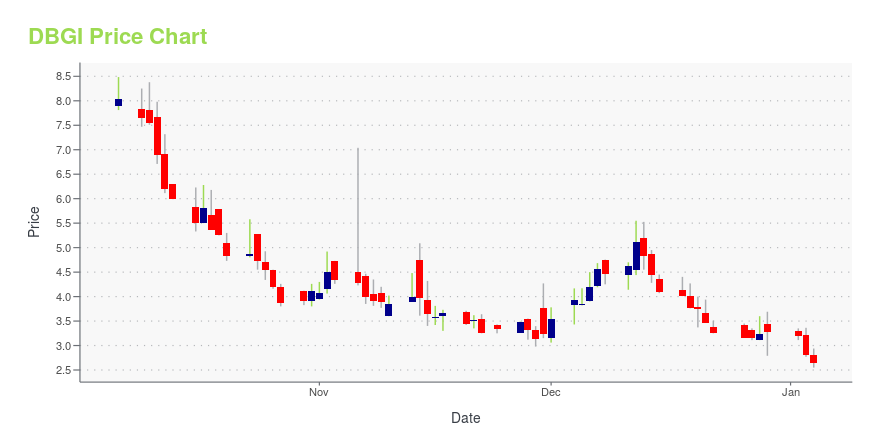
Digital Brands Group, Inc. (DBGI): Price and Financial Metrics
DBGI Price/Volume Stats
| Current price | $12.50 | 52-week high | $106.50 |
| Prev. close | $12.99 | 52-week low | $1.03 |
| Day low | $12.27 | Volume | 23,600 |
| Day high | $13.65 | Avg. volume | 50,740 |
| 50-day MA | $10.13 | Dividend yield | N/A |
| 200-day MA | $10.58 | Market Cap | 51.84M |
DBGI Stock Price Chart Interactive Chart >
Digital Brands Group, Inc. (DBGI) Company Bio
Digital Brands Group, Inc. provides apparel under various brands on direct-to-consumer and wholesale basis. It operates as a digitally native vertical brand that sources products from third-party manufacturers and sells directly to the end consumer through its websites, as well as through its wholesale channel in specialty stores, select department stores, and own showrooms. The company offers denims under the DSTLD brand; and luxury men's suiting under the ACE Studios brand. It also designs, manufactures, and sells women's apparel, including dresses, tops, jumpsuits, bottoms, sets, jackets, and rompers under the Bailey brand. The company was formerly known as Denim.LA, Inc. Digital Brands Group, Inc. was founded in 2012 and is headquartered in Austin, Texas.
DBGI Price Returns
| 1-mo | 52.44% |
| 3-mo | 133.64% |
| 6-mo | 143.90% |
| 1-year | -84.92% |
| 3-year | -99.96% |
| 5-year | N/A |
| YTD | 600.67% |
| 2024 | -98.91% |
| 2023 | -96.90% |
| 2022 | -98.17% |
| 2021 | N/A |
| 2020 | N/A |


Loading social stream, please wait...