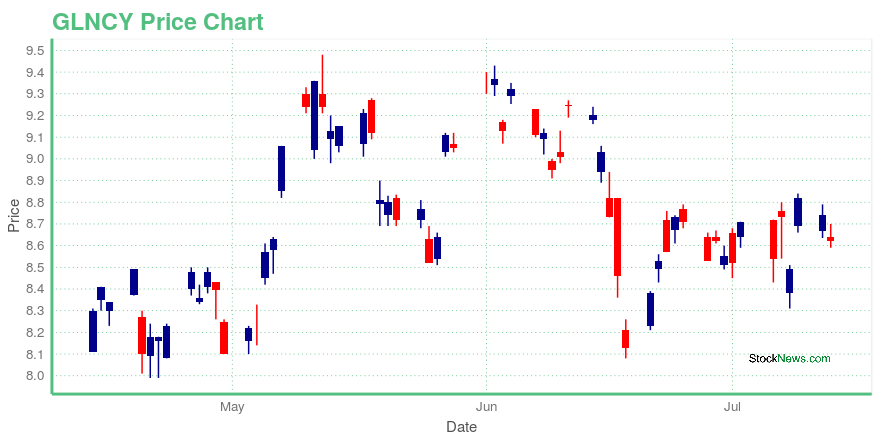
Glencore PLC ADR (GLNCY): Price and Financial Metrics
GLNCY Price/Volume Stats
| Current price | $8.32 | 52-week high | $12.44 |
| Prev. close | $8.33 | 52-week low | $5.74 |
| Day low | $8.30 | Volume | 369,100 |
| Day high | $8.39 | Avg. volume | 1,107,979 |
| 50-day MA | $7.38 | Dividend yield | 2.04% |
| 200-day MA | $8.65 | Market Cap | 49.64B |
GLNCY Stock Price Chart Interactive Chart >
Glencore PLC ADR (GLNCY) Company Bio
Glencore plc is an Anglo-Swiss multinational commodity trading and mining company with headquarters in Baar, Switzerland. Glencore's oil and gas head office is in London and its registered office is in Saint Helier, Jersey. The current company was created through a merger of Glencore with Xstrata on 2 May 2013. As of 2015, it ranked tenth in the Fortune Global 500 list of the world's largest companies. In the 2020 Forbes Global 2000, Glencore International was ranked as the 484th-largest public company in the world. As of July 2022, it is the world's largest commodity trader. (Source:Wikipedia)
GLNCY Price Returns
| 1-mo | 5.46% |
| 3-mo | 40.48% |
| 6-mo | -6.76% |
| 1-year | -30.94% |
| 3-year | -1.05% |
| 5-year | 136.74% |
| YTD | -3.45% |
| 2024 | -25.61% |
| 2023 | -2.04% |
| 2022 | 39.84% |
| 2021 | 66.17% |
| 2020 | 1.39% |
GLNCY Dividends
| Ex-Dividend Date | Type | Payout Amount | Change | ||||||
|---|---|---|---|---|---|---|---|---|---|
| Loading, please wait... | |||||||||


Loading social stream, please wait...