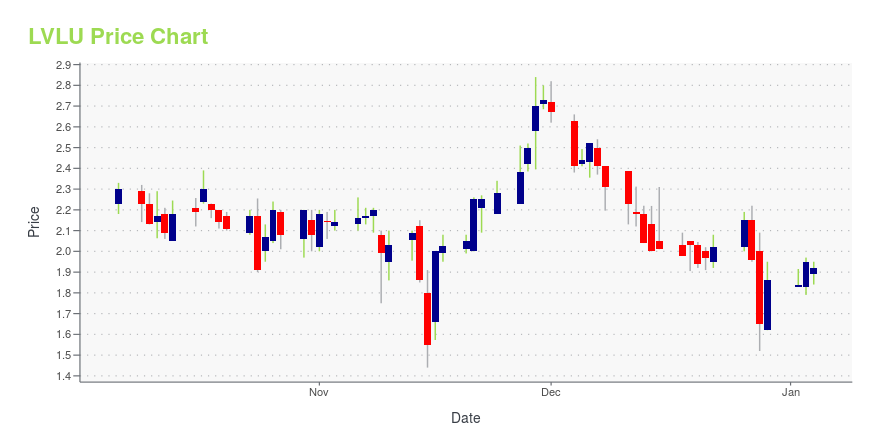
Lulu's Fashion Lounge Holdings, Inc. (LVLU): Price and Financial Metrics
LVLU Price/Volume Stats
| Current price | $0.43 | 52-week high | $1.95 |
| Prev. close | $0.42 | 52-week low | $0.33 |
| Day low | $0.39 | Volume | 57,745 |
| Day high | $0.43 | Avg. volume | 79,385 |
| 50-day MA | $0.42 | Dividend yield | N/A |
| 200-day MA | $0.98 | Market Cap | 18.46M |
LVLU Stock Price Chart Interactive Chart >
Lulu's Fashion Lounge Holdings, Inc. (LVLU) Company Bio
Lulu's Fashion Lounge Holdings, Inc. operates as an online retailer of women's clothing, shoes, and accessories. It offers dresses, tops, bottoms, bridal wear, intimates, swimwear, footwear, and accessories under the Lulus brand. The company sells its products through owned media, which primarily consists of its website, mobile app, social media platforms, email, and SMS; earned media; and paid media that consists of paid advertisement on search engines, such as Google and Bing, as well as social media platforms comprising Facebook and Instagram. It primarily serves Millennial and Gen Z women. The company was founded in 1996 and is headquartered in Chico, California.
LVLU Price Returns
| 1-mo | 2.38% |
| 3-mo | -33.33% |
| 6-mo | -64.46% |
| 1-year | -75.84% |
| 3-year | -97.82% |
| 5-year | N/A |
| YTD | -61.95% |
| 2024 | -39.25% |
| 2023 | -25.90% |
| 2022 | -75.46% |
| 2021 | N/A |
| 2020 | N/A |


Loading social stream, please wait...