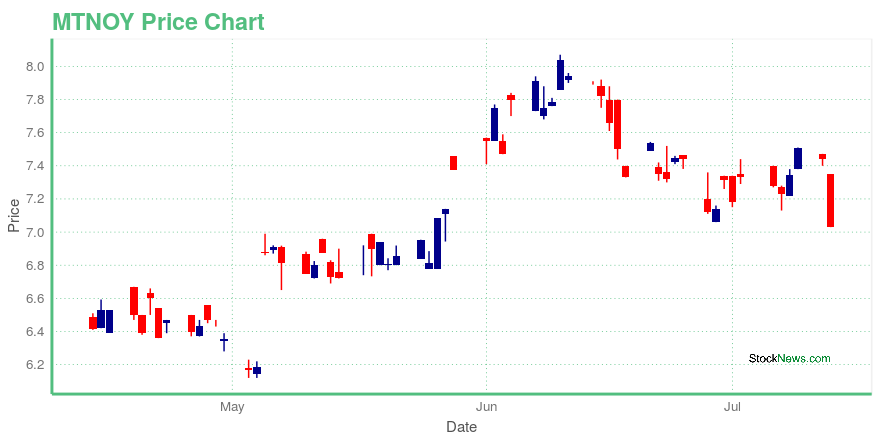
MTN Group Ltd. ADR (MTNOY): Price and Financial Metrics
MTNOY Price/Volume Stats
| Current price | $8.15 | 52-week high | $8.31 |
| Prev. close | $8.21 | 52-week low | $3.92 |
| Day low | $8.09 | Volume | 9,800 |
| Day high | $8.17 | Avg. volume | 36,780 |
| 50-day MA | $7.40 | Dividend yield | 1.53% |
| 200-day MA | $0.00 | Market Cap | 14.94B |
MTNOY Stock Price Chart Interactive Chart >
MTN Group Ltd. ADR (MTNOY) Company Bio
MTN Group Limited, formerly M-Cell, is a South African multinational mobile telecommunications company, operating in many African and Asian countries. Its head office is in Johannesburg. As of December 2020, MTN recorded 280 million subscribers, making it the 8th largest mobile network operator in the world, and the largest in Africa. Active in over 20 countries, one-third of the company's revenue comes from Nigeria, where it holds about 35% market share.(Source:Wikipedia)
MTNOY Price Returns
| 1-mo | 14.21% |
| 3-mo | 37.02% |
| 6-mo | 35.18% |
| 1-year | 97.64% |
| 3-year | 3.99% |
| 5-year | 117.31% |
| YTD | 71.97% |
| 2024 | -20.96% |
| 2023 | -13.73% |
| 2022 | -29.40% |
| 2021 | 159.88% |
| 2020 | -27.03% |
MTNOY Dividends
| Ex-Dividend Date | Type | Payout Amount | Change | ||||||
|---|---|---|---|---|---|---|---|---|---|
| Loading, please wait... | |||||||||


Loading social stream, please wait...