
Upbound Group Inc. (UPBD): Price and Financial Metrics
UPBD Price/Volume Stats
| Current price | $26.14 | 52-week high | $38.72 |
| Prev. close | $25.66 | 52-week low | $19.68 |
| Day low | $25.58 | Volume | 195,325 |
| Day high | $26.44 | Avg. volume | 545,754 |
| 50-day MA | $24.30 | Dividend yield | 5.92% |
| 200-day MA | $27.47 | Market Cap | 1.51B |
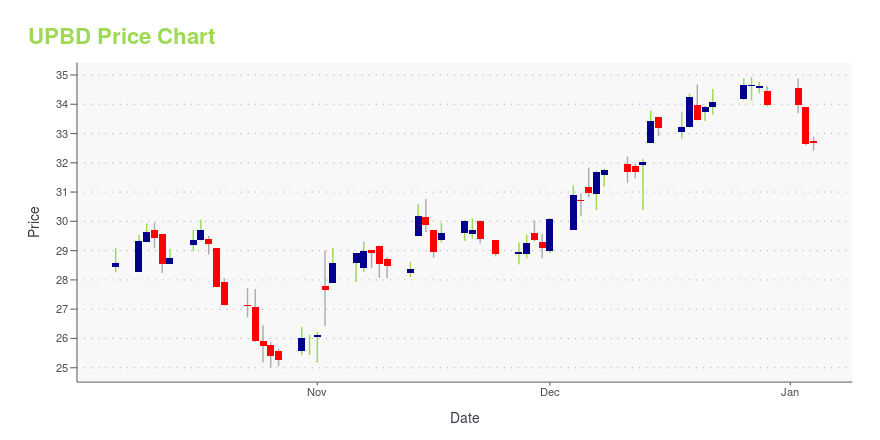
UPBD Stock Price Chart Interactive Chart >
UPBD Price Returns
| 1-mo | 4.43% |
| 3-mo | 18.61% |
| 6-mo | N/A |
| 1-year | -6.83% |
| 3-year | 48.78% |
| 5-year | 26.85% |
| YTD | -7.51% |
| 2024 | -10.06% |
| 2023 | 57.93% |
| 2022 | -49.90% |
| 2021 | 28.38% |
| 2020 | 39.76% |
UPBD Dividends
| Ex-Dividend Date | Type | Payout Amount | Change | ||||||
|---|---|---|---|---|---|---|---|---|---|
| Loading, please wait... | |||||||||
Loading social stream, please wait...