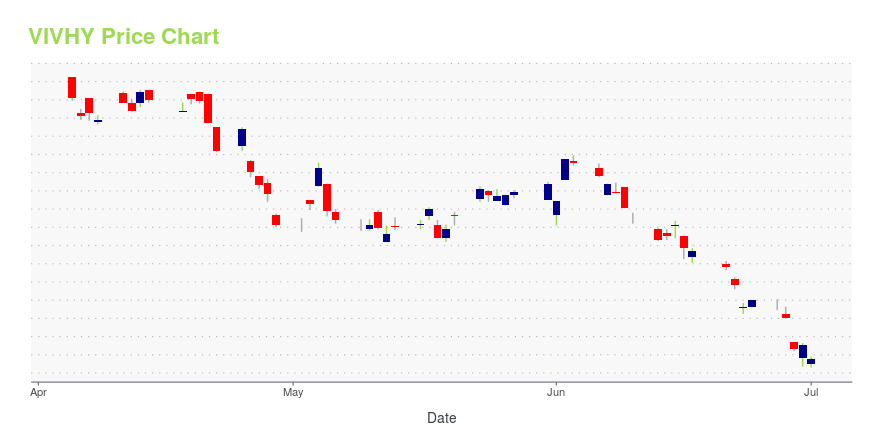
Vivendi (VIVHY): Price and Financial Metrics
VIVHY Price/Volume Stats
| Current price | $3.02 | 52-week high | $12.05 |
| Prev. close | $2.97 | 52-week low | $2.83 |
| Day low | $2.87 | Volume | 51,800 |
| Day high | $3.04 | Avg. volume | 172,453 |
| 50-day MA | $5.56 | Dividend yield | 323.78% |
| 200-day MA | $8.99 | Market Cap | 3.11B |
VIVHY Stock Price Chart Interactive Chart >
Vivendi (VIVHY) Company Bio
Vivendi, through its subsidiaries, conducts operations ranging from music, games, and television to film and telecommunications. The Company provides digital and pay television services, sells music compact discs (CDs), develops and distributes interactive entertainment, and operates mobile and fixed-line telecommunications.
VIVHY Price Returns
| 1-mo | 0.67% |
| 3-mo | 39.16% |
| 6-mo | -18.69% |
| 1-year | N/A |
| 3-year | -25.21% |
| 5-year | 52.87% |
| YTD | 43.19% |
| 2024 | -37.54% |
| 2023 | 14.23% |
| 2022 | -28.47% |
| 2021 | 28.02% |
| 2020 | 13.29% |
VIVHY Dividends
| Ex-Dividend Date | Type | Payout Amount | Change | ||||||
|---|---|---|---|---|---|---|---|---|---|
| Loading, please wait... | |||||||||


Loading social stream, please wait...