

Over the last decade, few things have moved the markets more than what the Federal Reserve does with monetary policy. In fact, it was the Fed taking an excessively hawkish stance on interest rates and its balance sheet roll-off (quantitative tightening) that caused the S&P 500, Dow Jones Industrial Average, and Nasdaq to go into free-fall in late December 2018. That culminated in stocks bottoming 19.8% from September’s high and came very close to ending the longest bull market in US history.
The Fed is meeting 6 times this year, but the quarterly meetings are by far the most important, and the next one is this week. And while investors might care about what the Fed does in terms of short-term interest rates on Wednesday, March 20th, this is actually the least important thing to focus on.
Here are the three things with the greatest potential to send stocks soaring, or plummeting, that investors may want to watch closely.
The Fed’s Revised Economic Forecast
The Fed is meeting every six weeks this year, but it’s the quarterly meetings (March, June, Sep, Dec) at which it provides its long-term guidance. That includes its expectations for key economic metrics, both in 2019 and for the long-term.
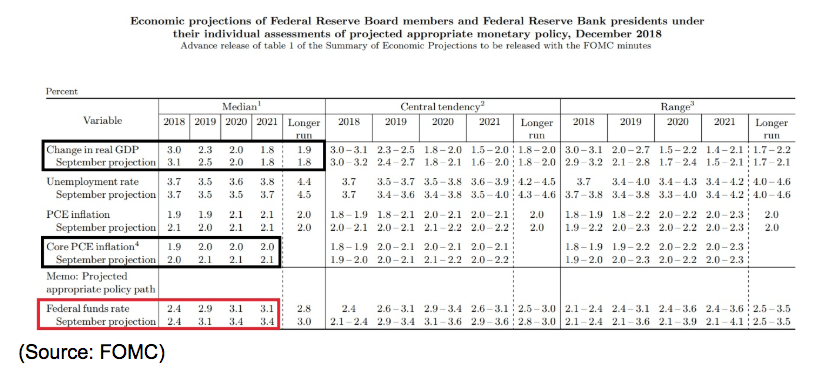
For example, here is the Fed’s latest economic forecast. As you can see, at the last quarterly meeting the Fed revised down growth expectations for 2018 and 2019, though held them steady for 2020, provided its first 2021 growth forecast, and slightly raised its long-term outlook.
Inflation expectations, per the core PCE (the Fed’s official inflation metric), were stable at the Fed’s long-term target rate of 2.0%.
Given that the economist consensus for US GDP growth in Q1 has been steadily falling for the last few weeks (due to weaker than expected economic reports), I expect the Fed will revise down 2019’s growth estimate to 2.2%.
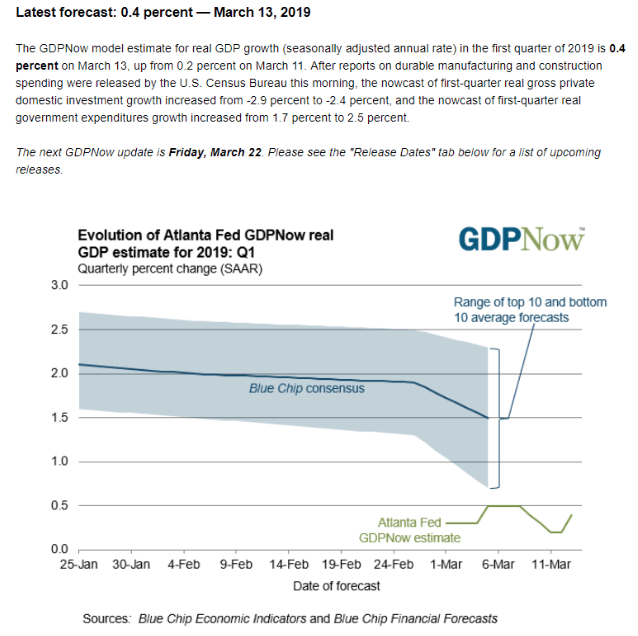
(Source: Atlanta Federal Reserve)
Note that the 1.5% GDP growth expected by most economists in Q1 is half the growth rate of 2018 and the New York’s GDP model is predicting 1.4% growth this quarter and 1.5% in the next.
If the New York Fed’s real-time model (based on dozens of leading indicators) is correct, then it will be very hard for the economy to hit the Fed’s previous target of 2.3%. 2% growth this year might be all we can expect even if we see a significant pickup in Q2 and Q3.
Inflation expectations might also come down to 2.0% per the Fed’s forecast, given that currently, the bond market is pricing in 1.9% 10-year CPE inflation, which generally runs 0.1% to 0.3% above core PCE.
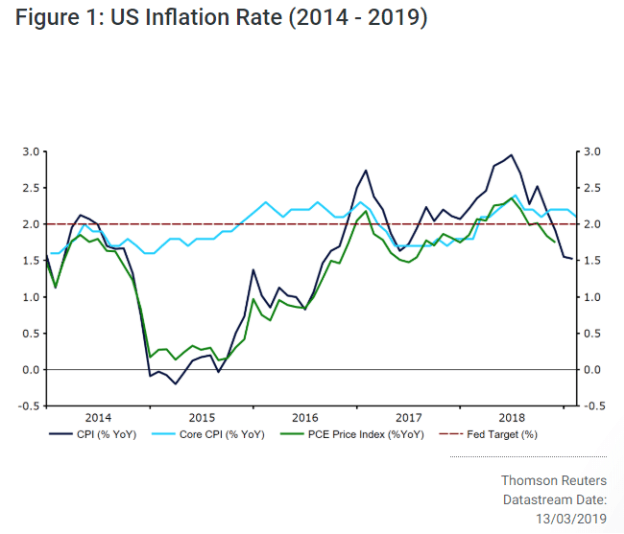
(Source: Ebury Partners)
As you can see inflation, no matter what index you use, inflation has been declining rapidly over the last few months, mostly due to a weakening economy.
The bond market, specifically, yields on US Treasuries, might react violently in either direction, depending on the Fed’s forecast.
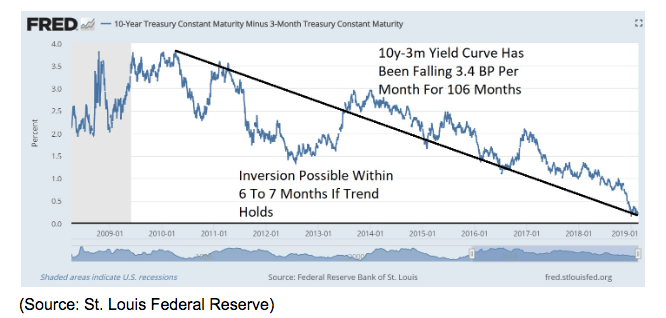
The 10y-3m yield curve, which sits at 0.15% right now (0.14% was the Dec 24th low and we hit it again recently), is the most important thing to watch in terms of bond yields. That’s because this is the most accurate recession predictor in history, according to a study by the San Francisco Federal Reserve.
And according to an October 2018 Dallas Fed survey of bank lending managers, it’s also the thing that banks watch closely to determine lending policy. If that curve goes below zero banks say they plan to pull back on lending to lower credit quality clients, likely causing the very recession they fear such an event would predict.
But the Fed’s economic forecast is not even the thing that will most affect the yield curve (which the stock market is also watching closely for obvious reasons). The Dot Plot is the most direct effect the Fed has on the yield curve and could send stocks soaring or crashing, depending on what it looks like.
The Dot Plot
Each quarter the Fed publishes the dot plot, which is its long-term forecast for interest rates. What freaked out the market back in December was the Fed forecasting a total of three more hikes, two this year and one in 2020 (with one cut by 2021).
What moves stocks in the short-term isn’t necessarily the fundamentals themselves, but how those fundamentals come in compared to expectations. After all, stocks are forward-looking and if valuations are low enough, even weak growth can beat expectations and send stocks higher.
In December the bond market was pricing in just one more rate hike (which we got in December) and then none in 2019 (and at least one cut in 2020). Thus the Fed’s dot plot of 3 more hikes coming was a major deviation from expectations, resulting in an accelerating plunge to December 24th’s lows (higher rates theoretically make stocks less valuable due to a higher discount rate on future cash flows).
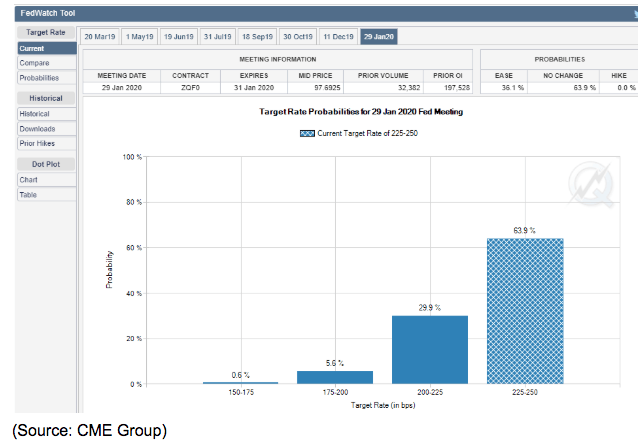
Currently, the bond futures market (where billions are invested to hedge against future interest rate changes) is pricing in a 1.3% chance of a rate hike at the March meeting. This is why investors shouldn’t worry about a change in rates, which are extremely likely to be left unchanged.
Rather what matters more is whether the Fed’s dot plot guidance, statement and press conference (2 PM EST on Wed) aligns with what the bond market expects for the rest of the year. As you can see, the bond market is currently pricing in virtually a zero chance of a future rate hike (through January 2020). That coincides with the Fed’s January 2019 statement that effectively said the rate hike bias is over and the Fed is done hiking for good barring an acceleration in inflation.
The bond market is pricing in a 36% chance of at least one rate hike (and possibly as many as three) and if the Dot plot remains “hawkish”, at least relative to that expectation, then stocks could take a sharp short-term hit.
Why might the Fed be less willing to forecast rapid rate hike cuts in the face of clear evidence of faster than expected economic deterioration? Because the economy is a complex and slow changing beast and the Fed might be worried about the tightest job market in 20 years causing wage growth to continue.
In February official wage growth was 3.4% YOY and 3.5% for non-supervisory positions (80% of US workers). Should net job creation average over 145K per month for the rest of the year, the amount needed to keep up with population growth, then the unemployment rate will keep falling and wage growth will likely keep rising.
Per the Phillips Curve (lower unemployment = higher inflation) that many Fed voting members still subscribe too, that could give some more hawkish members cause for concern and mean the Fed isn’t going to cut rates very quickly, even if economic growth comes in below its expectations.
But there is one other thing the market cares about and will be looking at closely on Wednesday.
End to Quantitative Tightening in 2019
The Fed’s over $3 trillion in bond buying, called quantitative easing, was an unprecedented effort to boost the economy by lowering long-term interest rates by directly buying 10-year US Treasuries and mortgage-backed securities.
In reality, it did little to stimulate the economy, which is what the Fed’s own studies have shown. What it did do is allow for epic amounts of borrowing by corporations at very low-interest rates (because corporate bond yields move based on 10-year risk-free yields).
That, in turn, allowed for a lot of M&A (80% of which fails according to the Harvard Business Review) but also $5.9 trillion in share buybacks. Many investors believe that this combination of overpriced M&A plus buybacks helped fuel an epic bubble in the stock market (plus many other asset classes).
By lowering the risk-free yield, income-focused investors who would normally park their cash in Treasuries were forced to go out further on the risk curve, by buying things like junk bonds, or dividend stocks. That’s partially true, because when 10-year yields bottomed at 1.36% post-Brexit, REITs, a naturally high-yield sector, soared into a bubble that popped when rates starting rising again.
But of course, as with most popular memes on Wall Street, this is an oversimplified view. One that states that Fed bond buying is why the market rose, and so now the Fed allowing up to $50 billion in bonds to mature each month without reinvesting the proceeds (reversing QE and tightening the money supply) will naturally cause stocks to also reverse course. Some investors even think QT could perhaps cause stocks to fall catastrophically, up to 70% according to famed permabear and hedge fund manager John Hussman.
But facts be darned, even stupid and oversimplified ideas can move stocks in the short-term and so one big reason the market fell hard on December 20th was Fed Chair Jerome Powell saying at the press conference that the balance sheet roll-off was “basically on auto-pilot”. Similarly, a big reason the market has rallied so much this year (up 13% YTD as I write this) is Powell saying, several times, and backed up by other FOMC members, that QT was not just on the table but possibly would end this year.
Now $360 billion per year in money tightening sounds like a lot, and it certainly does have some impact on the stock market. But keep in mind the total market cap of all US stocks is about $30 trillion, so even a full year of QT isn’t likely going to cause a market crash.
Still, the market will be listening closely to what the Fed says about QT ending this year, the sooner the better as far as it’s concerned. Personally, I’m a fan of QT and wish the Fed had avoided hiking rates so aggressively and just allowed QT to occur and undo whatever the financial market-distorting effects of that epic bond-buying program.
According to most analysts (and economists), the Fed is indeed likely to end QT in 2019, the only question is what month.
And as Art Hogan, chief market strategist at National Securities explains:
“This is the meeting where we get more clarity on the balance sheet reduction. Both those things would be an affirmation of where things are right now. It’s also technical…where we close [on the S&P] puts us on a precipice of breaking out.
Hogan is talking about the S&P 500 being able to close and sustain the 2825 level, which is a key resistant level the market has failed to breach three times now since bottoming in December. I’m not a technical trader, so I don’t care about technical analysis and such support/resistance levels.
BUT plenty of money is in the hands of short-term TA traders who, if they see the market react bullishly to the Fed’s statements and guidance on Wednesday could proclaim an “all clear” sign that might send the market much higher this year.
Mind you the current forward PE ration on the S&P 500 is 16.2, which is the exact 25-year average, according to JPMorgan Asset Management. That means that stocks are historically fairly valued and should, fundamentally speaking, rise no faster than earnings growth this year, which is now expected to be just under 4%.
Thus the 10% 12 month gain that most analysts expect (according to FactSet Research), isn’t justified by fundamentals alone but requires multiple expansion that I don’t think is justified. Not unless the economy ends up surprising to the upside, resulting in stronger than expected corporate earnings growth.
But if you care about short-term market movements (say because you’re a retiree using the 4% rule and need to sell stocks to pay the bills), then you definitely want to see the Fed take a very dovish stance on Wednesday, as pertaining to the dot plot, and plans for ending its balance sheet roll-off. Even a major downward revision in growth forecasts could be taken as a positive, since it all but assures the Fed does what Wall Street wants.
Bottom Line: While Fed Meetings Are Important These 3 Factors Are Going to Potentially Be the Most Market-Moving on Wednesday
I consider it sad the market is so obsessed with the Fed, parsing every word of its official statements and press conferences. But while I am a 100% fundamentals driven value-investor, nonetheless even I must concede that nothing can move the market quite like the Fed’s quarterly meetings.
What the Fed does with short-term interest rates is least important, because the forward-looking market will be watching three things far more intently.
- The Fed’s revised economic forecast
- The dot plot: specifically, the long-term forecast to see how many future rate cuts might be coming if economic growth continues to deteriorate
- Plans for the balance sheet roll-off, which is currently expected to end sometime this year (confirmation of this could send stocks up over 1% on the news)
While the Fed, ironically enough, is a very technocratic and data-driven organization, that doesn’t actually change its policies quickly, the market’s interpretations of its future actions are incredibly important.
So watch those three things on Wednesday, because most likely what happens then will decide whether or not the strong market rally we’ve seen so far, can continue in the coming weeks and months.
About the Author: Adam Galas

Adam has spent years as a writer for The Motley Fool, Simply Safe Dividends, Seeking Alpha, and Dividend Sensei. His goal is to help people learn how to harness the power of dividend growth investing. Learn more about Adam’s background, along with links to his most recent articles. More...
9 "Must Own" Growth Stocks For 2019
Get Free Updates
Join thousands of investors who get the latest news, insights and top rated picks from StockNews.com!
Top Stories on StockNews.com

Best & Worst Performing Mega Cap Stocks for July 11, 2025
AEXAY leads the way today as the best performing mega cap stock, closing up 34.37%.
Best & Worst Performing Mega Cap Stocks for July 10, 2025
AEXAY leads the way today as the best performing mega cap stock, closing up 13.49%.
Best & Worst Performing Mega Cap Stocks for July 9, 2025
AEXAY leads the way today as the best performing mega cap stock, closing up 13.49%.
Best & Worst Performing Mega Cap Stocks for July 8, 2025
AEXAY leads the way today as the best performing mega cap stock, closing up 13.49%.