The major indices have rebounded some 20% from their December lows and now stand less than 2% from all-time highs. But, several indicators, from economic data to investor sentiment suggest stocks may be heading for a fall.
While it’s hard to say, there’s anything bearish about the dramatic 13% year to date returns, which are the best first quarter performance in six years. There are some warning flags that the rally may not only be running out of steam but are due for a major correction.
For starters, we are seeing a similar divergence as last summer, when the S&P powered ahead, but cyclicals started to underperform defensives. Back then, in retrospect, it was an obvious warning sign about what was about to happen, .which was a waterfall decline into bear market territory.
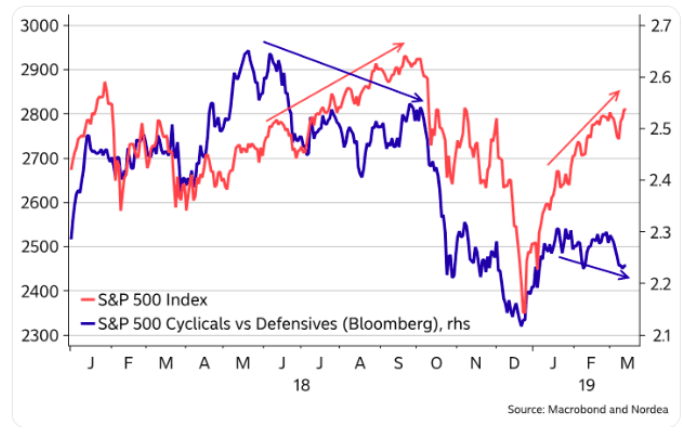
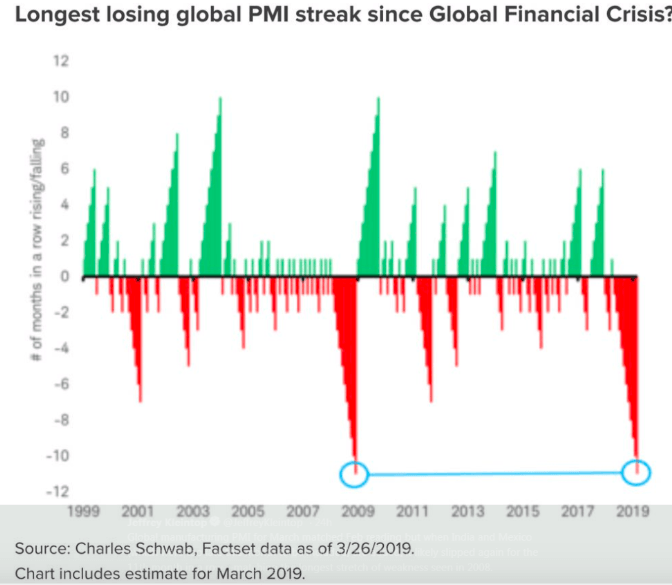
The weakness is that cyclicals can be tied to the now-record 13 consecutive monthly declines in the purchasing managers’ index (PMI) which measures business spending.
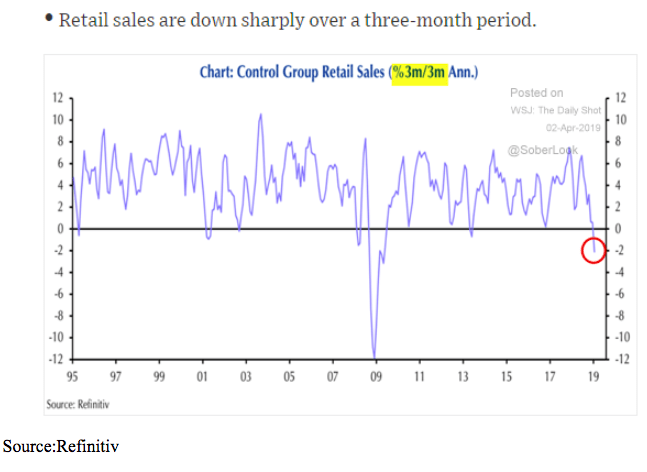
Consumer spending, which comprises some 67% of the U.S. economy, also continues to slide. Many had thought the record decline in retail sales, reported for December 2018, would be an anomaly, and then wrote of the January weakness due to weather and government shutdown. But, the March data also came in below expectations.
Another cause for concern is that despite the rally money flow into the U.S., equity funds have declined dramatically. The belief is that corporate buybacks and some may say Central Bank intervention, had been the marginal buyer propping up prices.
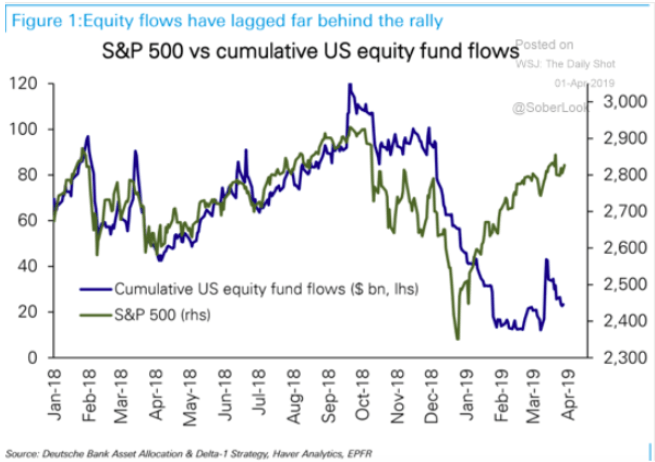
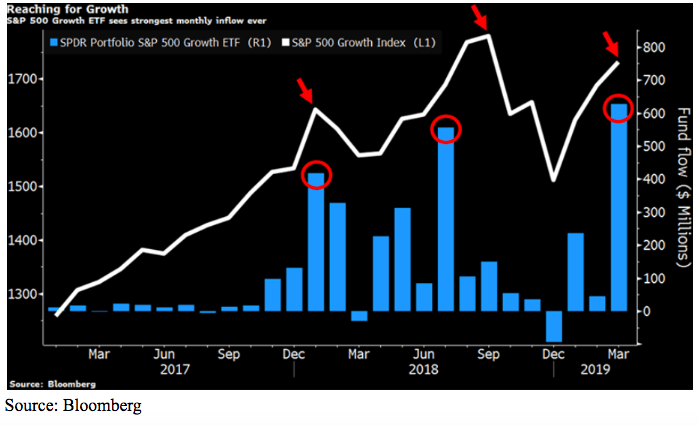
Also, masking the seeming contradiction between price and money flow is that the only area to see positive inflows are large-cap growth funds. Due to market cap weighting of the most popular indices, the gains in a handful of large tech stocks have helped propel the indexes.
In fact, March saw the largest monthly inflow to S&P 500 growth ETF ever. Of concern is that previous inflow extremes also preceded significant market selloffs. Record bullishness at near record valuations is never a good sign.
Lastly, there has been a dramatic increase in selling or shorting volatility or VIX based products.
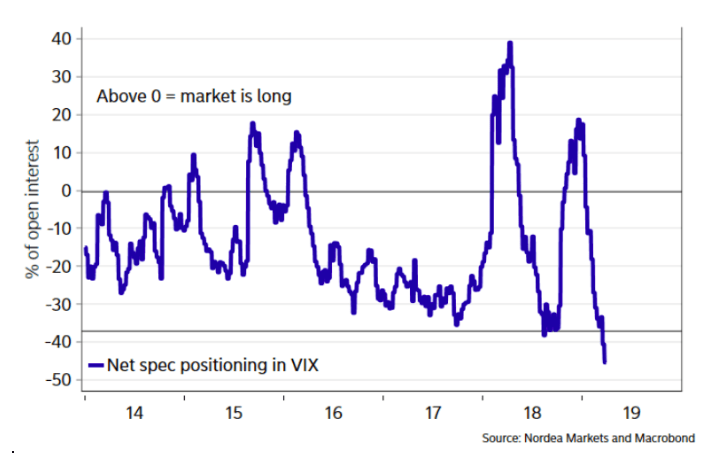
One can see that heavy shorting of volatility, a sign of complacency, tends to precede market declines.
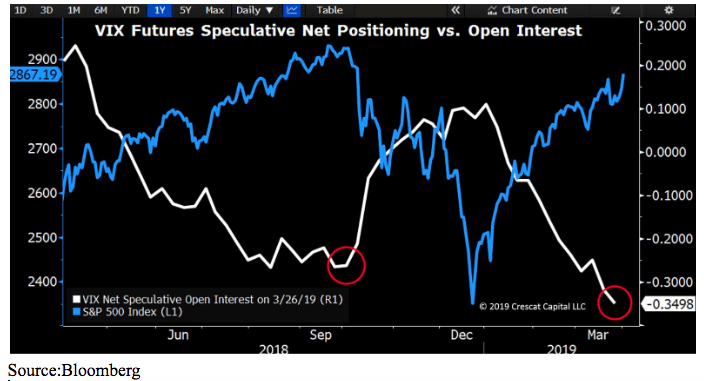
And right now the size of VIX short positioning by speculators is more extreme than it was just prior to the market selloff in Q4 2018.
All this adds up that investors should be prepared for a possible rough time as we head into second-quarter earnings reports.
If earnings start to show signs of slowing stocks will suddenly look overvalued could suffer a correction.
About the Author: Steve Smith

Steve has more than 30 years of investment experience with an expertise in options trading. He’s written for TheStreet.com, Minyanville and currently for Option Sensei. Learn more about Steve’s background, along with links to his most recent articles. More...
9 "Must Own" Growth Stocks For 2019
Get Free Updates
Join thousands of investors who get the latest news, insights and top rated picks from StockNews.com!


