

The market has nearly had vertical rebound. Now I expect it, and many individual stocks to have a period of consolidation. This could lead to the formation of one of my favorite technical chart patterns, the cup and handle, that will set up for a next leg higher.
The cup and handle pattern is a bullish continuation formation, it is one of the newer chart formations and can be easily identified on a price chart. This chart pattern was first popularized by William J. O’Neil in the first edition of his 1988 book, How to Make Money.
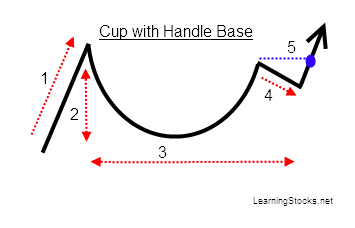
In order for the cup and handle setup to have the highest odds of succeeding, it should come after a clear uptrend is in place. The chart pattern consists of two key components: (1) cup and (2) handle.
The cup part of the formation is created when profit taking sets in, or the market itself is in a correction and the stock sells off and forms the left side of a cup. The cup bottom is formed when the stock finally runs out of sellers at new low prices and buyers start moving in and bidding the stock back up again as sellers demand higher prices to turn the stock over. Most of the time as the stock emerges out of the right side of the cup in an uptrend it fails and meets resistance the first time it tries to break out to new high prices and the pattern forms a handle. The second run usually works as the sellers have been worked through and the stock breaks out to new highs.
This pattern sets the stage for very nice uptrends because the majority of short term traders sold as the stock fell into the cup, the bottom was formed when the holders of the stock refused to sell for less than the support level in the base of the cup. Then profit takers were worked through as the stock came up through the right side of the cup. The investors and traders that sold at new highs for the first time that price level was reached — coming out of the cup were the last group of sellers to overcome as the stock breaks out of the pattern. The second time it is a lack of sellers that propels the stock upwards, as seats on the bull bus get more expensive because no one wants to give them up at that point in time.
Here’s a checklist for the cup-with-handle pattern to see if it truly puts the odds in your favor:
1. Cup and handle patterns are not good probability trades if the general market is in correction or in a bear market.
2. The pattern has better odds if it is a stock among a truly strong sector that has increasing earnings growth expectations.
3. The stock should have had a previous uptrend leading into this pattern.
Check the depth and length of the cup. A cup-with-handle base usually corrects 20% to 30% from the base’s left-side high, or 1-1/2 to two times the market average. Most are three to six months long, but can be as little as seven weeks, or as long as a year or more.
4. Look for a classic shape. If you have to argue your way into believing the shape is a cup, it’s not a cup.
5. Note, how much of the cup is in the lower half. A steady climb up the right side is best.
6. Look for a U-shape, and volume that dries up near the cup’s low. Volume that dries up at the bottom suggests funds lost interest in selling. And U-shaped bases are more likely to work than V shapes.
7. Limit risk by setting a stop just below the support level.
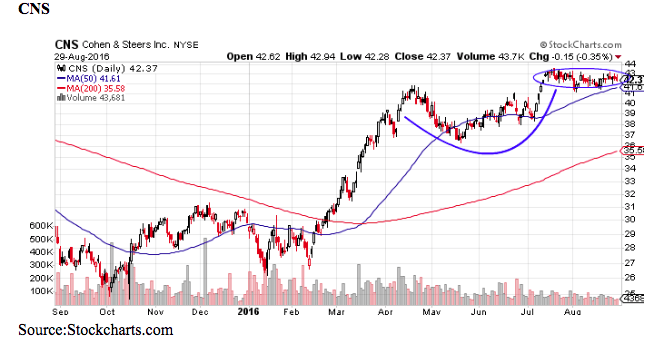
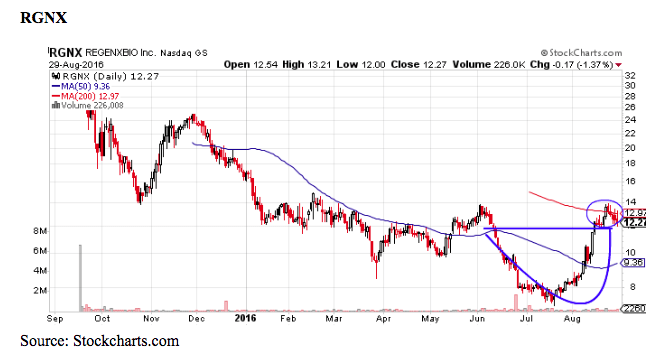
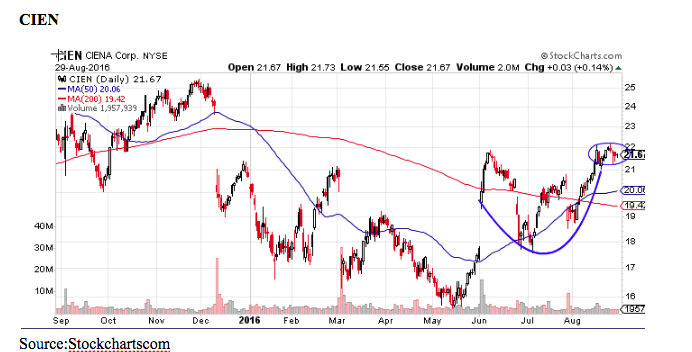
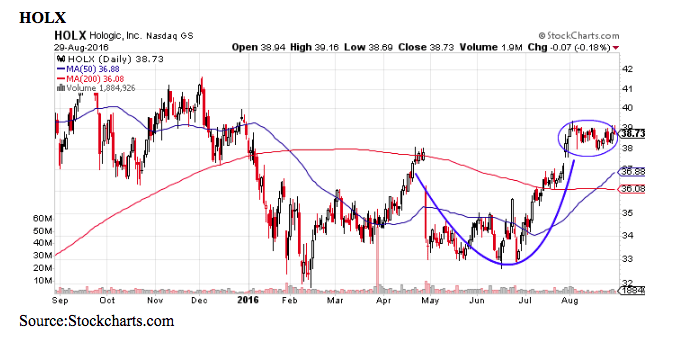
Some Potential Cup & Handles:
About the Author: Steve Smith

Steve has more than 30 years of investment experience with an expertise in options trading. He’s written for TheStreet.com, Minyanville and currently for Option Sensei. Learn more about Steve’s background, along with links to his most recent articles. More...
9 "Must Own" Growth Stocks For 2019
Get Free Updates
Join thousands of investors who get the latest news, insights and top rated picks from StockNews.com!
Top Stories on StockNews.com

Best & Worst Performing Mega Cap Stocks for July 9, 2025
AEXAY leads the way today as the best performing mega cap stock, closing up 13.49%.
Best & Worst Performing Mega Cap Stocks for July 8, 2025
AEXAY leads the way today as the best performing mega cap stock, closing up 13.49%.
Best & Worst Performing Mega Cap Stocks for July 7, 2025
AEXAY leads the way today as the best performing mega cap stock, closing up 13.49%.
Best & Worst Performing Mega Cap Stocks for July 4, 2025
AEXAY leads the way today as the best performing mega cap stock, closing up 13.49%.