

During the relentless rebound in January and February, all eyes were on a key level in the S&P 500. The thinking, being that if we could break through 2800, it would set up a move back to the old highs.
The index has broken through twice only to fail, emboldening the bears into claiming the V-like bounce was merely a short-term rally within a larger bear market.
As you can see from the SPY chart, the $280-$282 was the level the S&P failed three times during late 2018 sell-off. It finally broke through on March 4th. But it proved to be a one-day affair.
What followed was a 5-day 4% decline, and bears chanting the infamous “from false moves come fast moves,” referring to the fact that this seemed to be a false breakout. It seemed that with the $280 target achieved, that the rally was over, and bears may take back control.
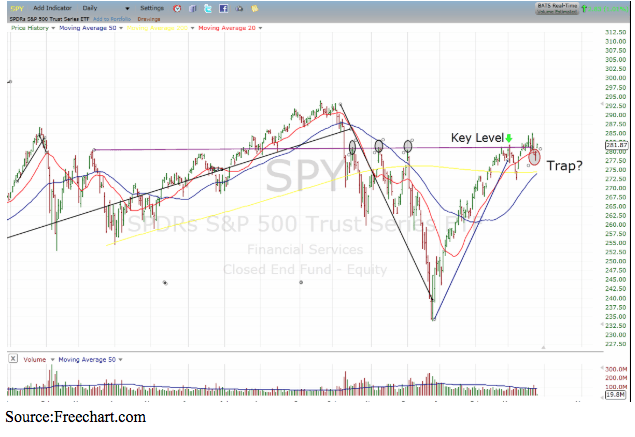
But, the bulls quickly charged back above the key level and held it for 6 days, making two consecutive new highs. But just when it seemed it was all systems go for a new leg higher, the rug was pulled again.
Last Friday, major indices all fell over 1.5%, and were back below key levels. The bears were thinking if, one failure/false move is good, two failures should prove even better.
On Monday we saw the bears back in the hunt. The S&P 500 continued its move lower, closing below the 20-day moving average.
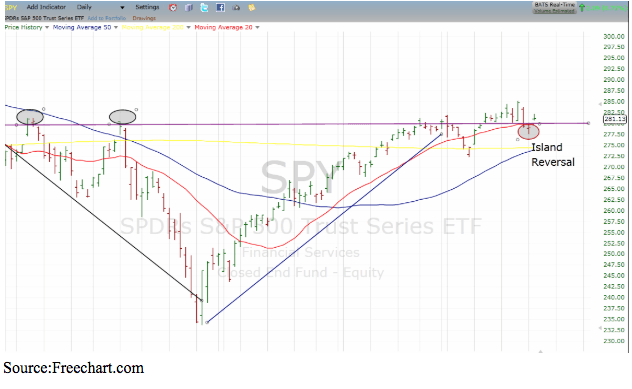
But, Tuesday saw a gap open it seems, yesterday might have been a classic a bear trap — a false reversal of the rising trend.
Now, with a single day island reversal, the $280 will become major support.
In addition to this being a technically bullish pattern, history also favors more upside in the months to come.
Over the past 25 years, there have been 17 occurrences in which the market has declined by 10% or more during a quarter, such as what occurred in the fourth quarter of 2018.
In 14 of those instances, stocks went on to gain an average of 11.2% in the next quarter. But it gets even better, if the market does achieve a 10% or more gain in that next quarter, which happened 7 of those 14 times, it goes on to gain an additional an average 12.4% in the next consecutive quarter.
With just three days remaining in the first quarter, the S&P 500 is currently up 11.9%. If it can hold that line, it’s a sign the bears will be trapped with little chance of escape.
About the Author: Steve Smith

Steve has more than 30 years of investment experience with an expertise in options trading. He’s written for TheStreet.com, Minyanville and currently for Option Sensei. Learn more about Steve’s background, along with links to his most recent articles. More...
9 "Must Own" Growth Stocks For 2019
Get Free Updates
Join thousands of investors who get the latest news, insights and top rated picks from StockNews.com!
Top Stories on StockNews.com

Best & Worst Performing Mega Cap Stocks for July 11, 2025
AEXAY leads the way today as the best performing mega cap stock, closing up 34.37%.
Best & Worst Performing Mega Cap Stocks for July 10, 2025
AEXAY leads the way today as the best performing mega cap stock, closing up 13.49%.
Best & Worst Performing Mega Cap Stocks for July 9, 2025
AEXAY leads the way today as the best performing mega cap stock, closing up 13.49%.
Best & Worst Performing Mega Cap Stocks for July 8, 2025
AEXAY leads the way today as the best performing mega cap stock, closing up 13.49%.