StockNews.com
  • Login Join

StockNews.com
  • News
    • Top Stories
    • Video News
  • Best Stocks
    • "A" Rated Stocks
    • Upgrades/Downgrades
    • High Yield Dividend Stocks
    • Stock Screener
    • Top Stocks by Target Price
    • Dividend Discount Model Stock Valuation
    • Industry Rank
  • Best ETFs
    • "A" Rated ETFs
    • Best ETF Categories
    • High Yield ETFs
    • 7 Best ETFs
  • POWR Ratings
  • Upgrades/Downgrades
  • Watchlist
  • Screener
  • Services
    • Services Home
    • POWR Platinum
    • Reitmeister Total Return
    • Stocks Under $10
    • POWR Options
    • POWR Value
    • POWR Screens 10
    • POWR Income Insider
    • Premium
  • Login Join


  • Home
  • Articles posted by Stock News
  • (Page 5)
  • Uncategorized

Options Trading: Using a Butterfly for a Bounce

Written by The Option Sensei (https://optionsensei.com/)

Stocks have been suffering the past few days, but it seems we might have reached a short term washout or capitulation point. So today, I’ll explain how to use options trading to take advantage of the current environment.

We’re already getting snap back rally this morning and while there might be some big intraday swings I think The S&P 500 Index moves back higher over the next week.

I’m using a low cost skip-strike butterfly spread to take advantage of a rebound in price and a decline in implied volatility.

Here are the pieces that are coming into play:

Sentiment reached decidedly fearful if not outright panic on Thursday with the lowest Fear & Greed reading since February.

Source: CNN Money.com

Implied Volatility on the S&P 500 jumped by over 50% in the past two days.  The VIX hit a high of 28.50 on Thursday and settled at 25.

Not only is this an extreme move in percentage terms but is also sent the term structure into backwardation.  That is front month futures trade at a premium to later dated months.

As the below image shows, compared to week earlier when term structure was in normal contango, there has been a big bend.

Source:VIXCentral.com

The backwardation is even more extreme when looking at the actual implied volatility of weekly options— remember the VIX is a 30-day snapshot.

Here we see the implied volatility of SPY options is at the 27%-30% level as of Thursday’s close.

Source:ETrade.com

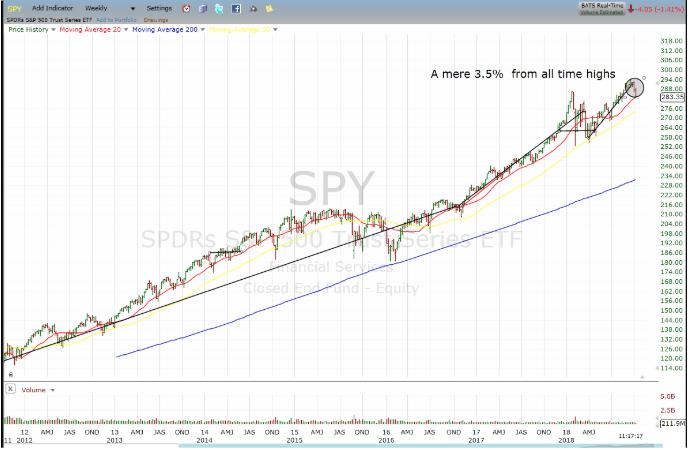
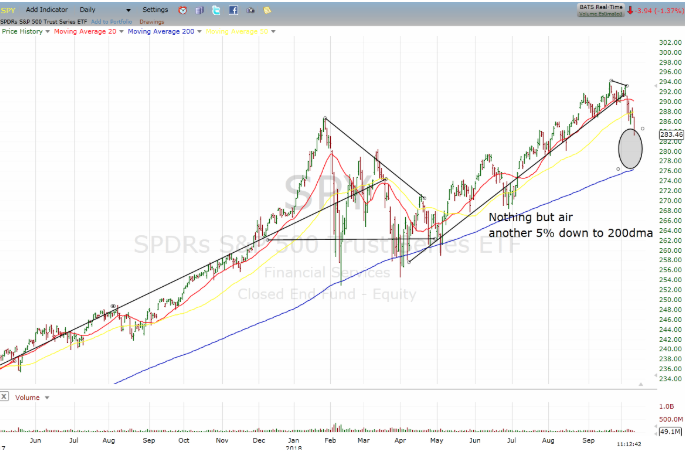
SPY Chart: It looks like it washed out at the $270 and it could bounce and consolidate near resistance at the $280 level.

Source:Freecharts.com

Strategy: Skip Strike Butterfly Spread. Unlike the traditional butterfly, which as a 1x2x1 structure with strikes equally far apart, the skip-strike (sometimes called a ‘broken wing’) has a 1x3x2 contract structure.

Here is the trade:

-Buy 1 Oct. 274 Call

-Sell 3 Oct. 280 Call

-Buy 2 Oct. 286 Call

For a Net Debit of $1.30(+/-0.10)

The advantage of the skip strike structure is it reduces cost and expands the profit range.

Be aware the risk/reward of butterflies. This position will need to be held until at least next Wednesday to realize a decent profit and the max value of the spread can be $6 or a $4.70 or 360% profit.

Max profit is only achieved if shares are at $280 on expiration, which is a low probability.

A realistic goal will be closing it on Wednesday or Thursday for $3 credit or about a 135% gain.

Here is the p/l risk/reward graph.

  • Home
  • Articles posted by Stock News
  • (Page 5)
  • Uncategorized

A Good Reminder for Traders

Written by The Gold Enthusiast (https://thegoldenthusiast.com/)

US markets had a terrible mid-week, with the Dow losing over 1300 points in just 2 days. International markets have also had a rough time, on top of a rough time – check out this daily chart of QEMM compared to the Dow over the last 3 months.  The blue line is the Dow, candles are QEMM.

(credit Fidelity.com)

You can easily see that while the US stock market has generally been heading up the past 3 months, emerging markets have had a hard go of it. The trend there says “lower highs and lower lows,” which as we all know is the recipe for a downtrend.

DWM, the highly-ranked Wisdom Tree International Equity ETF, tried hard to hang on, banging its head against resistance 3 times before succumbing to downward pressure in late September. The writing was on the wall though, as it was making lower lows on downswings between attempts.

(credit Fidelity.com)

In the meantime gold, as we know, has been going sideways for 2 months after its low in mid-August. Some overseas markets have seen gold rise as their local currencies declined.  Yesterday gold prices finally woke up in the US markets, too.

(credit Fidelity.com)

Despite what you might want to believe, all this does not mean gold is now safe and will run up steadily from here.  Markets don’t go up and down in straight lines, there are dips and jogs and swerves along the way. What this latest action does do is reveal gold is still seen as having value (number 1), gold is not dead (number 2), and we can expect gold to run up should markets REALLY drop (number 3).

Why is your friendly Gold Enthusiast implying that markets haven’t really dropped?  Didn’t we just tank 1300+ points in 2 days, and isn’t 1300 points a lot? Yes, and no.  Remember your percentages and basis’es. 1300 points of change against a 26-thousand point basis is just exactly 5 percent.  And it takes a 10 percent change to enter correction territory. So even though a 1300 point drop is indeed “a lot”, as a 5-percent change it’s still just normal action in an uptrend.  We’ll have to see the Dow break down more than 10% to be concerned.

Now if investors start fleeing equities left and right – yep, that’d drop it down more than 10%.  And from what we’ve seen, gold prices will surge – and fast.

DISCLAIMER: The author has no positions in any mentioned security, with no plans to initiate any in the next 48 hours.  The author is long NUT and JNUG and is looking for short-term trading opportunities in these over the next 48 hours.

  • Home
  • Articles posted by Stock News
  • (Page 5)
  • Uncategorized

3 Reasons Amazon Is A Strong Buy And Why I’m Tripling My Position

Written by The Dividend Sensei (https://dividendsensei.com/)

Recently I explained why I initiated a position in Amazon (AMZN), which I consider a must own, buy and hold forever growth stock. In fact, there are six reasons Amazon is the only non dividend stock I intend to own in my high-yield income growth retirement portfolio. Since I made that purchase tech stocks in general, but Amazon in particular, have sold off. The Nasdaq is now 8% off its all time high, while Amazon has fallen 14%, putting it officially in a correction. The cause of the sell off is largely due to long-term interest rates spiking sharply higher for four main reasons.

But while some might look upon such a sharp price drop and cringe, I’m taking a very different, long-term, value focused approach. So let’s take a look at the three reasons why I am taking advantage of this correction to triple my position in Amazon. Most importantly, we’ll see why, despite what many investors fear, Amazon is likely  NOT a bubble stock likely to crash 50% to 80%, but is actually 10% to 20% undervalued. This means today is a great time for long-term investors to add the greatest growth story of our age to their diversified portfolio.

Lowering Your Cost Basis And Building Positions Over Time Is The Core Of Successful Long-Term Investing

Many investors think that stocks are inherently risks and no different than gambling. And while it’s true that short-term trading is fraught with peril, long-term investing is as close to a “sure fire” way to get rich over time as you can find in this world.

The core difference is that traders are looking for quick profits, derived from swing trades or even day trading in and out of a stock with modest profits. In contrast long-term investors take a completely different view. We recognize that a share of stock is an ownership stake in a real company, whose management and employees are working to maximize long-term cash flow growth and shareholder value. Thus long-term investors focus on steadily accumulating more shares over time, hopefully at prices that are at, or below fair value. When a stock drops it’s actually a great opportunity to lower your risk by reducing your cost basis. That’s because quality companies like Amazon appreciate over time as their sales, earnings, and cash flow grow. This means that during corrections like this one, you can increase the size of your share of the company’s assets and future cash flow, all while lowering your breakeven price. When the stock eventually recovers, as it does for all quality companies, you’ll own more shares at a lower cost basis, resulting in much larger capital gains.

Best of all, remember that price is an integral part of risk management. The lower your cost basis the lower your risk of a permanent loss of capital. This is why it’s generally a good idea to dollar cost average into a stock (building positions over time), as long as the company is at fair value or less. If you can lower your cost basis? Well that’s an even better time to add to your position. But of course there is a very important caveat to dollar cost averaging and reducing your cost basis by buying during corrections and bear markets. Adding to a position should only ever be done as long as the fundamentals remains healthy and the investment thesis (why you bought the stock), remains intact.

Fortunately, Amazon’s fundamentals have never looked better, which is why I can buy with confidence at today’s prices.

Amazon’s Fundamentals And Investment Remain Stronger Than Ever

Amazon’s investment thesis is centered around continued strong top line growth, which thanks to rising margins, means even stronger earnings and cash flow growth in the coming years. That thesis has three cornerstones.

The first is Amazon’s dominant position in retail, both online and more recently, in brick & mortar. This is the lynchpin of Amazon’s ecosystem, which is designed to lock in consumers into with ever improved convenience and values, such as created by its fast growing Prime Membership (now over 100 million subscribers). Amazon’s domestic and international retail sales are growing at 44%, and 27%, respectively. That’s both thanks to a big push into offering ever more products (over 100 million) to consumers in ever more countries. And delivering them with ever greater convenience, including as fast as two hour deliveries in some markets.

Thanks to this laser like focus on ever improving convenience and value, Amazon’s share of online sales in the US hit 49.1% in July of 2018, according to analyst firm eMarketer. That’s eight times greater than its nearest rival eBay, showing just how dominant the company is in this fast growing space. Amazon’s total retail market share in America is about 5%. That small figure is due to the fact online sales still make up just 10% of US retail sales. But according to Statista that is likely to keep increasing for the foreseeable future, hitting 13.7% by 2021. Or to put another way, Amazon’s fast growth in America’s $525 billion (and rapidly expanding) online retail market is likely to continue for many more years.

Online Sales As % of US Retail

Source: Statista

But ultimately, while Amazon will likely be able to keep improving its operating margins on retail sales (5.7% currently, up 200% in the past year), it’s major earnings and cash flow drivers are going to be its fastest growing and most profitable businesses, Amazon Web Services (cloud computing) and advertising.

Amazon Web Services or AWS, was launched in 2006 as a way of letting corporate partners rent excess cloud computing space that Amazon needed to run its core retail business. Amazon had already spent 10 years streamlining its computer based logistics and data analysis in house, and AWS has proven to be its largest and most successful entrance into a new market ever.

That’s because AWS is growing at 49% per year (three straight quarters of accelerating YOY growth), and generating annualized revenue of over $24 billion. More importantly, operating margins on AWS are excellent, 26.9%. More importantly, Amazon’s pricing power in cloud is strong enough, and its cost cutting good enough, that that margin is up 21% in the past year.

Those margins keep improving largely because Amazon’s early lead in cloud and artificial intelligence driven data analysis applications mean that today Amazon controls 35% of the global cloud computing market. And since its AWS revenue is growing as fast as the market in general (50%) that market share has remained stable over time.

In the past year Amazon added over 800 new applications to AWS, which allow companies to better use their stored data to increase productivity and profitability. It’s also added a new corporate database transfer system that 80,000 corporate clients have taken advantage of. Currently Amazon says it has a growing backlog of clients waiting to migrate their databases to AWS, which bodes well for revenue and cash flows from that business continuing to grow quickly or even accelerate in the next few quarters.

Analyst firm Gartner estimates that the global cloud market will hit $186 billion in 2018, and grow to $303 billion in 2021, or 18% annually. Amazon’s market share in cloud is likely to increase, because of strong network effects in cloud and AI driven data analytics. Basically, the more customers move to AWS the more data Amazon has to feed its AI algorithms and the faster its machine learning based system can improve. That creates ever improving cloud offerings and a stronger competitive advantage that locks in more customers into the AWS ecosystem and raises Amazon’s pricing power (and margins). But as great as AWS is from a profit perspective, the best thing about it, and Amazon’s overall business strategy, is how the company leverages its retail and cloud business into its newest and greatest growth market of all, online advertising.

Global online advertising is a $273 billion market currently, but eMarketer expects that to grow 16% annually to $427 billion in 2021.

Amazon’s online advertising business is currently growing at 130% per year and eMarketer expects it to achieve 4% market share in 2018, second only to Google and Facebook. By 2020 that market share is expected to grow to 7%. But there is good reason to believe that Amazon’s ad business will remain its best profit growth engine in the coming years. That’s because Amazon’s advertising is based on deep data analysis, generated by its AI powered AWS. After 20 years of collecting and analyzing customer data, Amazon knows retail tastes better than even Google. That’s why 55% of all US product searches are done directly on its site. It’s also why Amazon’s ad conversion rates (what % of ad clicks convert to sales) is 250% higher than Google’s. That higher conversion rate means it can charge more for ads volumes that are growing rapidly (but that consumers actually find useful). Combined with the fact that advertising overhead is very low (runs on AWS) and you get sensational operating margins that Piper Jaffray estimates are currently 75%. For context Facebook and Alphabet’s operating margins are 44% and 28%, respectively.

What this combination of super growth in online sales and sky-high margins (because overhead is covered by other businesses) means is that by 2021 Piper Jaffray estimates that Amazon’s ad business will be generating $16 billion in operating profits each year. That’s actually more than the $15 billion AWS is expected to deliver. Combined AWS and advertising could deliver $31 billion in operating income, which would be nearly triple the company’s entire operating profit over the past year.

The bottom line is that, despite what many investors think, Amazon’s growth isn’t necessarily going to slow in the coming years, due to the “law of large numbers”. In fact, it’s revenue growth has averaged between 20% and 25% per year (currently 39%), since 2003. That means Amazon’s growth has actually slightly accelerated in recent years. This is because it finds new giant and increasingly profitable markets to break into. More importantly, because of how it leverages data and costs across its various business segments, the company’s profits and cash flow are growing even faster than its stable but impressive revenue growth. That operating cash flow is then reinvested into further expanding its economies of scale (cost cutting such as via automating warehouses) to further boost profitability.

Ok, so maybe Amazon’s growth isn’t likely to slow anytime soon, and its profitability is set to rise significantly thanks to excellent margins on AWS and advertising, it’s fastest growing businesses. But what about valuation? Surely Amazon’s recent 14% slide is proof that the stock was in a bubble, which might lead it to much lower levels right? Actually, both I, and the conservative analysts at Morningstar, think Amazon is significantly undervalued today.

Amazon Is 10% To 20% Undervalued, Making Today A Great Time To Buy

When it comes to highly innovative, disruptive, and fast growing companies like Amazon valuation, is an educated guesstimate at best. That’s because you have to try to model numerous factors far into the future to try to get an idea for the fair value of the company today. While there are dozens of approaches one can use, when it comes to a complex growth machine like Amazon, I and Morningstar tend to favor a discounted cash flow model or DCF. This estimates the fair value of a stock based on the net present value of all future cash flow and earnings.

While not a perfect system, since it can be highly dependent on changing long-term smoothed out growth assumptions and the discount rate you use , it does allow you to factor in several of the company’s most important fundamental variables. The reason I trust Morningstar’s DCF estimate is because its analysts are 100% long-term focused, fundamentals driven, and usually far more conservative than analysts in general. Thus their estimated fair values tend to represent the lower end of a reasonable buy price.

Morningstar’s three stage DCF model assumes the following growth through 2022:

  • physical stores: 9% CAGR
  • online retail: 13% CAGR
  • third-party seller services: 26% CAGR
  • AWS: 33% (with operating margins rising to 30%)
  • Subscription Services (Prime): 37% CAGR
  • Advertising: 66% CAGR
  • Overall company sales growth: 23% CAGR
  • Overall operating margins: 8% (vs. 5.6% in Q2 2018)
  • Overall company operating income growth: 33% CAGR

How reasonable are those assumptions? Well while we don’t have access to other analysts proprietary models, we do have their overall consensus growth forecasts. Those call for 57% and 50% CAGR EPS growth over the next five and 10 years, respectively. Note that Morningstar is estimating just 33% earnings growth, far below the consensus figure. So what does Morningstar’s DCF model estimate is Amazon’s net present value of future earnings and cash flow? Morningstar thinks Amazon is fairly valued at $2,200, or 20% above today’s price.

But let’s say you want to be even more conservative than Morningstar, who is already assuming much slower growth than the rest of Wall Street. This is where my personal simplified, but even more conservative DCF model comes in. I use a 2 stage DCF that assumes the following:

  • 2018 EPS (analyst consensus): $17.30
  • 10 year CAGR EPS growth: 25% (half of analyst consensus and lower than Morningstar’s)
  • Terminal growth rate (growth beyond 2028): 10%
  • Discount rate: 13% (most people use 6% to 12%)
  • Estimated fair value: $1,947
  • Discount to fair value (margin of safety): 10%
  • Expected 10 year CAGR return: 15% to 25%

My DCF model assumes that when Amazon finally runs out of new growth opportunities (new markets to conquer) it will be generating massive free cash flow due to slowing of capital investment. That FCF can then be used to initiate a large buyback program, along the lines of what Apple has been doing in recent years. This in turn will allow its EPS over the long-term to maintain double digit rates. In addition, to err on the side of caution, I use a very high discount rate of 13%. The discount rate is your target return, and since 1871 the S&P 500 has delivered 9.2% total returns. Other popular forms of discount rates are based on the risk free rate of return (10 year treasury yield + risk premium). Usually discount rates used in DCF models range from 6% to 12%.

A 13% discount rate, combined with far smaller growth assumptions than other analysts, means that my DCF estimate for Amazon is potentially conservative. Yet even it shows Amazon 10% undervalued. Under the Buffett principle of “it’s better to buy a wonderful company at a fair price, than a fair company at a wonderful price”, I’m happy to buy Amazon at fair value or better. In fact, my long-term plan is to use my dividend income to buy more shares each quarter, two weeks ahead of earnings, as long as the price is at or below fair value.

So with Amazon between 10% and 20% undervalued, I consider it a fantastic time to initiate or add to a position in this world class growth company. One that I expect to generate market beating annualized total returns of 15% to 25% over the coming decade from today’s levels.

Bottom Line: Thanks To Tech Correction Amazon Is A Great Buy Today, Which Is Why I Am Tripling My Position

Don’t get me wrong, I’m not predicting that Amazon is necessarily bottoming. It’s a high volatility growth stock, that has historically been 80% more volatile than the S&P 500. In the short-term investor panic selling, especially of index funds and ETFs, could very well drive Amazon significantly lower than the current price of $1,755. However, for long-term, fundamental investors this kind of volatility is a blessing in disguise. Because the very same short-term price risks (high volatility, heavy concentration in index funds) that can cause the shares to drop quickly, also means they are likely to overshoot to the downside.

Thus such times as this are perfect for building out your position in a world class growth machine like Amazon. You can lower your cost basis, and thus reduce your risk, while boosting long-term total return potential. Best of all, despite claims that Amazon is in the mother of all bubbles, conservative discounted cash flow models say it’s actually 10% to 20% undervalued. That means today is the perfect time to “be greedy when others are fearful” and add this proven innovation and disruption powerhouse to your diversified portfolio.


  • Home
  • Articles posted by Stock News
  • (Page 5)
  • Uncategorized

Will Dow Jones Plunge Pop Gold?

Written by The Gold Enthusiast (https://thegoldenthusiast.com/)

By now you know the Dow dropped 800+ points yesterday as investors woke up to the reality of rising interest rates. One might say an 800-point drop in one day is overreacting, and it might be.  Common sense, rational market thinking, and fundamental analysis would say that if rising interest rates were a “problem” then the market should have factored in higher interest rates when they first learned about them, which was, oh, about a year ago.  But in that year the market has gone up-up-up.

If you think we’re trying to convince you that the markets are not fully rational you’re right.  Investor psychology is probably the second biggest unknown in the market, besides the dreaded black swan.  Yesterday’s drop was not a black swan event, however, because the market already knew about interest rates – for some reason, people just decided they had enough and bailed, big time.  (Or was it the black boxes that hit their Sell buttons? We may find out about that in the coming days…)

In any case, what we want to do is try to make money from all this.  And since we trade gold and gold miners, let’s look there.  Gold miners have been in a deep funk lately so that’s probably the place we’ll see the biggest gains.  Here’s the chart of GDX for the past 3 months.

GDX chart, fidelity chart

Source: Fidelity.com

We’ve drawn in the current resistance line at 19.24, and the next level up at 19.81.  The 19.24 level is defined by multiple highs that couldn’t get past that price.  It’s the most simple technical analysis tool.

The next level up takes some explaining, but it’s not too hard.  Technicians call “gaps down” in a chart “falling windows”.  The upper level in a falling window is the bottom of the upper candlestick.  Which is where the 19.81 price comes from.  See, that wasn’t so bad.

The difference in these is only 57 cents.  It’s hard to think of 57 cents as a target you want to chase hard.  What can one do?

Well, one can turn to a leveraged ETF for the gold miners.  Since we were looking at GDX, which is an ETF for senior gold miners, we can look at NUGT, which is a 3x leveraged ETF against GDX.  Note that NUGT is based on GDX, not its own basket of mining stocks.  This makes our job a bit easier as we don’t have so many things to watch.

Here’s the 3-month chart for NUGT, with two levels that correspond to the GDX levels we just found.

NUGT Chart, fidelity chart

Source: Fidelity.com

In this case, the levels are at 14.34 and 16.76, for a range of 2.42.  And that 2.42 is against a lower base price of 14.34, rather than the base for GDX at 19.24.  You can see why short-term traders prefer NUGT over GDX, while longer-term traders who don’t like so much volatility go for GDX.

You might want to keep an eye on NUGT these next few days.  If NUGT does get up through 14.34 and investor concern continues, this might be one of the few bright spots in the market.

DISCLAIMER: The author is long NUGT and JNUG, and may trade these positions over the next 48 hours.  The author has no position in GDX and has no intent toward that security.  Position sizes in question are not large enough to affect the market.

  • Home
  • Articles posted by Stock News
  • (Page 5)
  • Uncategorized

3 Steps for Longterm Portfolio Protection

Written by The Option Sensei (https://optionsensei.com/)

Stocks have been taking it on the chin over the past few sessions but it’s not too late to use options to put some portfolio protection in place. While the recent sell-off may feel bad it needs to be put in long term; after years of a low volatility bull market this just a blip on the screen as the S&P 500 is just a mere 3.5% from the all-time high.

SPY Chart

Source: FreeStockCharts.com

Zooming in a but to the daily chart we can see that the recent breach of trend line may lead to deeper pull back towards the 200-day moving average which is around $275 or another 4% lower.

SPY Chart

Source: FreeStockCharts.com

While it is essentially true that ‘put protection’ is now less expensive on a relative basis than it was in past years, it can still prove quite costly on an absolute basis in terms of the drag on your returns.

Two of the mistakes investors make in using puts for hedging protection are:

  • The buy more insurance needed relative to their holdings or risk profile
  • The buy puts that outright that are too far out-of-the-money which only provide only “disaster protection” rather than buffering more likely 10% decline.

Let’s look at some of the concepts for buying the right and appropriate portfolio protection.

Spreading

In my options trading at I try to have individual positions that have their own internal hedges by using spreads. These usually take the form of basic vertical spreads in which you both buy and sell options with the same expiration but different strike prices.

The essential function of a spread will be reducing the cost and mitigating the impact of changes in implied volatility and the negative impact of time decay time.

I also frequently use options on the Spyder Trust (SPY) to provide the overall portfolio with broader protection. Typically, individual positions tend to be bullish, while the portfolio protection chunk usually consists of the purchase of puts or put spreads. Let’s take a look at how this concept can be applied to a less active and basically bullish-oriented portfolio.

Buying put options does offer the most complete and probably efficient way to hedge a position, but it comes at a cost. That cost, as with all insurance policies, will be a function of the amount of protection and its duration.

The main items to consider when choosing put protection, whether for an individual stock or a broad equity portfolio, are as follows:

What magnitude of a decline is expected?

Like any insurance there are two basic components to what type of coverage you decide to purchase.

  • How much damage or what level of the decline do you want the position to be fully hedged or protected?
  • The term or For what length of time do you want the protection in place?

Answering these questions will help you determine the appropriate number of puts to buy at a given strike with a certain expiration date. By using the basic application of delta in which an at-the-money option is expected to move $0.50 for every $1 unit price move in the underlying security, one can begin to assess how much and at what levels cost protection can be purchased.

Combination Approach 

If you’re really looking for a true, longer-term hedge — that is, you don’t expect to make many changes or adjustments to your portfolio for six months or more — using a combination of strategies might make sense.

For example, I suggest the following three-step approach, which uses SPY options to create portfolio protection for a $150,000 portfolio:

1. Buy a put spread of closer to-the-money strikes that have about six months remaining until expiration. With the SPY trading around $285 one can buy the January 2020 285 puts and sell the January 270 puts. Such a spread could be bought for around $3.00 net debit. For a $150,000 portfolio, purchasing about 100 of these might provide reasonable protection. But because we’re protecting it in two ways (read on), buying 25 spreads should suffice.

2. The next step is to sell a call spread for a credit, such as selling the January 300 calls and buying the January $310 calls. This call spread can garner about a $2.50 net credit. Remember, as a spread, this won’t limit your upside. You could probably sell up to about 50 or 60 of these spreads.

Just be aware that there’s a “dead zone.” If SPY is between 300 and 310, then you’ll lose $7.50 on this position. But I assume you’d be making money if stocks rallied another 15% to $310 SPY points from current levels. You can use higher strikes or sell fewer spreads to align with your risk profile.

3. Finally, use the proceeds of the call spreads to buy some out-of-the-money (or OTM) puts outright to provide deeper downside protection. For example, the $7,000 proceeds from the call spread would finance the purchase of about 20 of the January 255 puts. These OTM puts give you outright disaster protection should the market incur a 10% or greater decline.

The total outlay would be about $11,000 — or about 7% of the $150,000 portfolio — which isn’t too steep for over 14 months of portfolio insurance.

This is just a loose construct — you can play around with the numbers — but I think the best hedges will ultimately involve more than simply picking one strike.

  • Home
  • Articles posted by Stock News
  • (Page 5)
  • Uncategorized

This Stock is Ready for a Short Squeeze

Written by The Option Sensei (https://optionsensei.com/)

Earlier this week I highlighted how bears were making money shorting stocks.  But short selling can be a dangerous game, as you’re always at risk of a short squeeze inflicting large losses.

A short squeeze happens when a stock has a large portion of its float sold short.  Remember, every share sold short is like an embedded buyer, as those shares will eventually need to be bought to close the position.

If the stock price begins rising for one reason or another the people who are short maybe be forced to buy to cover or close their positions as they need to limit losses or get a margin call from their brokerage firm.  This in turn drives the price higher, forcing even more short covering and before you know it the squeeze is on.

I think Gamestop has multiple pieces in place for just such a squeeze to take place in coming weeks.

  • Fundamentals: People have been predicting the death of Gamestop for over a decade, basically assuming it will meet the same fate of Blockbuster or other physical/mall-based retailer whose product can more easily purchased online.
  • But a few things that have allowed the GME to defy the odds; it has retained a lock on the profitable, albeit shrinking, used game resale/trade in segment. It’s created a more interactive experience in the stores encouraging young gamers to come and hang out. It’s successfully growing its digital/online sales and lastly, it has a rock solid balance that allows it to pay a dividend of $1.52 per share, which currently equals a 10% yield.
  • Technical/Chart: In September, the stock quickly recovered from a sharp sell-off and in the process broken a long-term downtrend. It has now consolidated into a bullish wedge at the $14.50 support level.  It looks ready to move higher.

As mentioned above, there is an extensive history of people who believe the company is going to be ‘Amazoned’ out of existence. This has created large short interest with over 32% of the float sold short. This creates the possibility for a squeeze.  

To profit from a potential for a short squeeze I want to buy calls outright. This will give us the full leverage and ability to exit for maximum profit at any point prior to expiration:

I’m buying the October (10/19) 14.5 calls for around $0.50 each.

I have a price target of $16.5, which would give the calls a minimum value of $2 for a 150% gain.

  • Home
  • Articles posted by Stock News
  • (Page 5)
  • Uncategorized

Why Amazon’s $15 Minimum Wage Is Great For Shareholders And The Economy

Written by The Dividend Sensei (https://dividendsensei.com/)

Amazon just announced it will be raising its minimum wage to $15 for all US workers (and $12.30 to $13.59 for its 20,000 UK employees). Shares fell about 1.5% of the news, potentially due to investor concerns that higher wages would slow the company’s recent margin expansion in its bread and butter North American retail business.

However, as an Amazon shareholder myself (there are six reasons Amazon is the only non dividend stock I plan to own), I’m actually thrilled at this news. That’s because I consider it a brilliant long-term strategic move by the company that will ultimately enrich shareholders. More importantly, it also bodes well for wage and thus broader economic growth that could keep the bull market running for years to come.

Amazon Hiking US Minimum Wage To $15: What Investors Need To Know

Amazon’s higher wages go into effect on November 1st. While many US companies (like Walmart and Target) have vowed to eventually raise their minimum wages to 15 years, that’s spread out over several years. The higher wages will affect 250,000 full time US employees as well as 100,000 season employees the company is hiring ahead of the Christmas shopping season.

According to the Washington Post, warehouse pay for Amazon employees currently ranges from $12.25 in Omaha, Nebraska, to $16.50 per hour in New York City. Those making over $15 will get a $1 per hour bump as well. While bonuses and stock grants are being eliminated as part of the wage hike plan, overall worker benefits will increase. This is because employees will continue to receive Amazon’s already generous benefits package which includes:

  • Comprehensive healthcare, including medical, dental, and vision coverage
  • Company-paid life and disability insurance
  • Up to 20 weeks of paid parental leave
  • 401k matching
  • Career Choice, which pre-pays 95% of associates’ tuition for courses in high-demand fields, whether those jobs are at Amazon or another company
  • Career Skills, which trains hourly associates in critical job skills like resume writing, how to communicate effectively, and computer basics

But hiking wages for hundreds of thousands of employees will surely hurt short-term margins right? So how can I, as an Amazon shareholder, be so excited about this much higher worker pay? Because as Bezos told investors in 2017 “you have to think in four to seven year time frames”. And over the long-term Amazon’s higher pay is nothing short of a genius move that will help enrich not just its shareholders, but all US investors.

A Brilliant Long-Term Strategy That Will Make Long-Term Shareholders Rich

There are three reasons why Amazon hiking wages so aggressively is great for long-term shareholders. The first is that it effectively neutralizes rising political risks, including criticism by Bernie Sanders and his supporters that Amazon is taking advantage of workers, thus necessitating government intervention. For example, Sanders, a rising star in the Democratic Party that has an 80% chance of taking control of the House in November’s elections, recently introduced the Stop Bad Employers by Zeroing Out Subsidies (BEZOS) bill. While this bill has no chance of making it past the Senate (who GOP is still likely to control next year), or President Trump’s veto pen, it represents a greater long-term threat to Amazon and large corporations everywhere.

The BEZOS bill specifically claims that large companies like Amazon, by paying their workers wages that are too low (specifically below $15 per hour), are being subsidized by Federal anti-poverty programs like food stamps and healthcare programs. To eliminate this subsidy Sanders proposed a “100 percent tax on corporations with 500 or more employees equal to the amount of federal benefits received by their low-wage workers.” Ultimately that tax would likely be higher than merely raising wages to $15 per hour, thus Amazon is likely to save money in the long-term should the Democrats ever regain control of all three branches and pass this bill. That’s possible in 2020 or 2022, depending on the outcome of the next presidential election. But as great as Amazon sidestepping future regulatory risk is, there’s an even bigger reason for Amazon shareholders to cheer these wage hikes. That’s because warehouse wages are already rising quickly, thanks to the strong economy creating the tightest job market in 20 years.

Source:Jeff Miller

Today official (U3) unemployment is 3.9%, and the more accurate underemployment (U6) is 7.5%. Both figures are falling rapidly due to strong job creation that’s outpacing the growth rate in the labor force (about 125,000 per month). In fact, the more important U6 rate is falling about twice as fast as the official U3 unemployment rate.

Source: FOMC

What’s more, despite slower economic growth expected in the coming years, the Federal Reserve thinks U3 unemployment will fall to 3.6% in 2019 and 3.5% in 2020 and 2021. U6 will likely continue drifting lower meaning that companies will find it harder to find and retain good workers. What that means is rising wages, especially for warehouse employees that Amazon is hiring at a furious pace as it expands it North American logistics network.

In the past year warehouse wages have grown 6.7% to $13.30 per hour according to industry analyst firm Prologistix. And according to Brian Devine, president of Prologistix, within the next 12 to 18 months, even without Amazon’s wage hike, warehouse employer wages would have risen to $14.10 per hour (another 6%).

This means that Amazon was likely to have to raise wages anyway, just to remain competitive with competing firms. But by moving earlier than most in boosting earnings (even for those making over $15 per hour), Amazon will become a far more competitive firm, better able to dominate online retail as well as all its other fast growing markets. That’s because, according to Gerald Storch of the retail consulting firm Storch Advisors, “This will lead to a general increase in minimum wages in all industries…The weaker retailers have been cutting costs and squeezing every penny…They are in a very tough place.”

In an ever tightening job market, where there are more job openings than workers looking for jobs, companies have to remain competitive and attract, and retain, quality workers in order to grow. Amazon, who employs 575,000 workers globally, was already one of the most desired places to work. For instance,  Amazon was named #1 on LinkedIn’s 2018 Top Companies list, ranks #1 on The Harris Poll Corporate Reputation survey, and is  #2 in Fortune’s World’s Most Admired Companies survey. Now with even higher pay (and the same competitive benefits package), Amazon will find it even easier to attract an army of quality workers to help it grow and dominate ever more markets.

And don’t forget that Amazon has the immense size and economies of scale to be able to bear the short-term burden of higher wages far better than smaller rivals. If those rivals (like retailer Sears) end up going bankrupt, then Amazon will eat their market share. Thus it will likely be able to boost sales and actually earn more than it did when it was paying lower wages. And over the long-term thanks to its heavy investment into automating its warehouses and creating ever more productive workers, Amazon’s margins are likely to rebound from the temporary dip caused by this wage hike.

Ultimately this is why I’m enthusiastically endorsing Bezos’ long-term focused, strategic decision to jump ahead of his rivals, and make Amazon an even more competitive company. Thus I’m reiterating my “strong buy” recommendation on the stock which my conservative discounted cash flow valuation model says is worth $2,239 per share today (about 13% undervalued).  That means that over the next decade Amazon should be capable of delivering about 20% annualized total returns, making it a great long-term growth investment.

But as great as this news is for Amazon investors, it’s also wonderful news for all American workers, and investors.

Great News For Future Wage Growth, Long-Term Economic Growth, And Stocks In General

The worst financial crisis since the Great Depression, and most severe recession since WWII, has meant US wage growth has been rising at a painfully slow rate. But when we look at median wage growth, which eliminates the negative wage growth effects of 10,000 retiring baby boomers each day, we see that wage growth has been steadily rising since 2010.

Source: Atlanta Federal Reserve

And more importantly, that wage growth isn’t limited to high paying, high skilled jobs like computer programs and doctors. As we just saw, wage growth for lower skilled jobs like warehouse employees is soaring at rates not seen since the tech boom of the 1990’s (when wage growth was 4% to 6%). Rising wages, despite what many economists fear, are not a large driver of inflation, as long as productivity growth is high enough to match it. That’s because if productivity rises 3%, then wages can grow at 5%, and inflation will remain at the Fed’s long-term target of 2.0% core PCE (where it’s been sitting for four straight months). Last quarter the Bureau of Labor Statistics reported US worker productivity rose at its highest level in four years, 2.9%. This is why, despite slowly accelerating wage growth, core inflation is not spiking higher, which would force both short-term and long-term interest rates to rise (thus slowing the economy). Most importantly of all, rising wages, in addition to fueling strong consumer spending (65% to 70% of US economy), is also a key ingredient in long-term productivity growth. That’s because if wages are low, then companies have little incentive to invest in productivity boosting technology like automation. But if wages are high and rising? Well then corporations have two key reasons to spend more heavily on expanded and more efficient capacity.

The first reason is that growing demand means their current capacity is no longer sufficient to meet demand. Thus company’s need to invest in expanded capacity, say by building new, larger, and more productive factories. And because of rising wage pressure that threatens their margins, companies have large incentives to buy the latest and greatest technology that lets each worker producer more goods/services per hour. This lowers per unit production costs, and helps maintain or even grow margins.  On top of that higher paid employees means lower turnover, which is an incredibly costly things for companies. Replacing workers that quit (to move to other better paying firms), takes a lot of time, results in less efficient workers at first, and disrupts day to day operations and thus hinders growth and profitability. Corporate tax cuts, as well as the ability to instantly expense capex through the end of 2022, means that companies now have the incentive (created by stronger consumer spending), and more financial resources to invest in game changing technologies that could dramatically increase productivity and double long-term economic growth.

In fact, analyst firm McKinsey estimates that in the 2020’s (and 2030’s) new technologies such as 5G, the internet of things (IOT), and AI driven automation will allow US productivity to rise to at least 2%, but potentially 2.5% or even 3%. That, combined with America’s long-term 1% growth in our labor force (mostly due to immigration) means that for a period of 10 to 20 years, our economy might grow at 3.5% to 4.0% annually. All while potentially supporting wage growth of 4.5% to 5% while keeping core inflation at the Fed’s target of 2.0%.

What would that mean for US investors? Well strong and potentially rising profit margins, earnings, cash flows and dividends for one. It would also mean that long-term interest rates would likely stabilize at 3% to 3.5%, far below their historical norm of about 5%. That’s because long-term interest rates (10 year yield that market most cares about),  are primarily priced in the bond market on future inflation expectations. Today both the 10 and 30 year Treasury bonds are pricing in long-term core inflation of just 2.1%. This means that as long as inflation doesn’t rise above that (remember it’s currently 2.0%), then interest rates are not likely to move much higher. What do you get when you combine strong and rising wages, brisk consumer spending, a strong economy, booming corporate profits, and interest rates that remain stable at today’s levels? A continued bull market that could run for several more years, and make possible the financial dreams of tens of millions of Americans.

Bottom Line: Like Bezos Amazon Shareholders, And Investors In General, Have To Think About The Big Long-Term Picture

There is a common, but false assumption that rising wages are bad for corporate profits. Another common belief is that rising wages stock inflation, resulting in higher interest rates, and potentially recessions if rate hikes go too far. While this may be true for some firms in the short-term, ultimately higher wages help fuel stronger consumer spending, which makes up 65% to 70% of the US economy.

More importantly, rising wages, courtesy of a strong economy and ever tightening job market, induce companies like Amazon to invest in productivity boosting equipment such as robots that are now working alongside the company’s fulfillment center employees. Higher productivity is the cornerstone of long-term economic growth. That’s because it allows unit costs of goods and services to fall, thus allowing for margins to be preserved or even expanded, despite rising labor costs. In terms of Amazon’s big wage hike investors need to realize that it was a stroke of strategic genius. Not just does it neutralize the company’s long-term political risks, but it will mean that Amazon will be able to attract, and more importantly, retain, top worker talent in the tightest job market in 20 years. It will also put increased pressure on Amazon’s rivals to match its wage hikes, which many won’t be able to bear financially. Thus the comapany will enjoy potentially even higher market share and profits in the future due to these wage increases.

As Costco’s legendary high pay and great benefits have proven over the decades, happier and more productive workers, combined with lower turnover, is the key to superior customer service, wide moats, and great long-term shareholder returns. Meanwhile, Amazon’s higher pay will help induce many more companies to follow suite. That means more spending power for Main Street Americans, which will likely keep retail sales, and thus the economy in general, stronger for longer than many currently expect. That in turn, when combined with the coming productivity boom of the 2020s, could keep corporate profits and stock prices rising for many years to come. Or to put another way, Amazon’s big wage hike isn’t just great long-term news for its shareholders, but for all US investors in general.

  • Home
  • Articles posted by Stock News
  • (Page 5)
  • Uncategorized

Commodity News: This Country’s Fears Are Boosting the Precious Metal

Written by The Gold Enthusiast (https://thegoldenthusiast.com/)

Just when everyone was ready to give up on gold – that “ancient relic” — suddenly rebounded back above 1,200.  That’s right, gold popped back above $1200 USD per oz in early New York trading, and is presently cruising sideways above that mark.

gold chart, gold activity

Source: Kitco.com

The credit for this pop goes to Italy, which is trying to stave off heading down the same path as Greece.  During 10 minutes after news of Italy’s lack of progress in their credit woes, traders drove gold and silver prices back up above 1,200, which you can see in the chart above.

“Geopolitical uncertainty” is a phrase every trader needs to keep in mind.  The past 10 years have arguably been the most prosperous time in US market history, certainly in the past 50 years.  Even in the midst of the good times there is always a black swan that can appear and wreck the party.  Whether it’s runaway deficit spending, wars, or banks overextending themselves, traders and investors need to stay aware of pending threats to the good times.

This Gold Enthusiast doesn’t think that Italy will tank overnight; the EU has too much riding on it.  The old axiom that those in power will do whatever is necessary, to stay in power, applies here. The EU central bankers are making warning noises toward Italy as the country tries to sell bonds abroad to stay afloat.

It’s kinda funny actually because that was exactly the strategy the ECB used to float Greece.  Despite their current warning noises, we can expect the EU central bankers to “help” Italy find low-interest credit, probably strong-arming other members of the EU to buy (junk) Italian bank bonds. Or even go to more extremes…  But like what happened with Greece, eventually they will run out of other people’s money, and Italy will have a reckoning.

Or, if the ECB does “mutualize” debt as discussed in the previous article, the whole EU will have some very rough times.

But that will take some time yet.

  • Home
  • Articles posted by Stock News
  • (Page 5)
  • Uncategorized

Market News: Smart Bears Are Starting to Profit

Written by The Option Sensei (https://optionsensei.com/)

The overall market keeps marching to new highs, but one group of smart bears are making money from it. In quite a turnaround from a year ago, the most heavily shorted stocks of the S&P 1500, —those that have the largest bearish positions — got crushed in September (through 9/27), falling 4.25% on average compared to a small gain for the S&P 1500.

This not only stands in contrast to the 1.7% gain for the S&P 500, but is a dramatic turnaround from a year agowhen 20 of the most heavily shorted shares posted a 10.31% average gain in September. That vastly outpaced the mere 1.2% lift in the broader market for that month.

That means from a year ago, the shorts went from pain to gain. I think this change in performance is a good and healthy sign for the overall market.  It means investors are becoming more discerning and the companies that a group of smart investors feel the fundamentals don’t support a current valuation, are being rewarded rather than squeezed by indiscriminate buying.

Where the Bears Roam

Tesla (TSLA) is among the most heavily shorted in terms of both dollar amount ($9.9 billion) and percentage of float (26%). It also most contentious as the company and its founder Elon Musk make headlines daily. The cult-like bulls are convinced TSLA will become a trillion dollar company and change the world.  The bears think Musk is a fraud and the company will go bankrupt. They’ve each have had moments of pleasure and pain as the stock has swung wildly between $250 and $320 — twice during the month.  For now, it’s a draw as the shares are basically flat on month and the year.

Applied Optoelectronics (AAIO), with 39% of the float short, delivered the best gains for the shorts, as shares dropped a whopping 31% during September.

Other names that were honeypots for bears were Medicines (MDCO) with 27% float short, saw shares drop 25% during the month and Restoration Hardware (RH) off 17%.

Gamestop (GME) delivered the most pain as shares, of which 31% are sold short, jumped 16.7% during the month.  But the stock is still down some 15% for the year to date.

The upshot is, the market is now offering good two-sided action where smart stock can identify winning bearish trades within the big broad bull market.

  • Home
  • Articles posted by Stock News
  • (Page 5)
  • Uncategorized

3 Things Investors Need To Know About The Future Of Interest Rates

Written by The Dividend Sensei (https://dividendsensei.com/)

The Federal Reserve is the most powerful central bank on earth, and its decisions about interest rates have wide ranging ramifications for global capital markets, the economy, and ultimately the stock market. So let’s take a look at the three most important things investors need to know about the last Fed meeting, the future of interest rates, and most importantly how it will effect your portfolio.

Fed’s Forecast For Economy

The most important thing to know about the Federal Reserve’s Open Market Committee or FOMC (which sets US monetary policy), is its dual mandate. That would be to minimize unemployment (strong economy) while maintaining stable prices (core inflation of 2.0% over the long-term). The Fed uses various models in determining where to set its Federal Reserve Funds Rate or FFR. That’s the overnight lending rates that banks charge each other for overnight loans. Banks index their prime rate, (from which short-term and variable lending rates are set) to the FFR. Thus when the FFR rises, so do consumer borrowing costs. This is why the Fed uses the FFR to try to stabilize the economy, by either slowing or accelerating growth by indirectly affecting consumer spending which makes up about 65% to 70% of US GDP.

Under current Fed Chairman Jerome Powell, the Fed has stated it’s being driven by the data, specifically the current and expected growth rate in GDP and inflation. Thus to understand where the FFR is likely to go we need to know where the Fed thinks where the economy, inflation, and unemployment are headed.

Source: FOMC

The Fed’s latest estimate of US GDP growth showed an increase in 2018 and 2019’s expected growth rates, from 2.8% and 2.4%, respectively, to 3.1% and 2.5%, respectively. 3.1% economic growth (which we’re on track to hit this year from the latest data), would be the fastest full year growth since 2005.

However, the Fed expects growth to slow in 2019 and 2020 as the stimulus effects of tax cuts and $300 billion in greater government spending wear off. By 2021 the FOMC expects growth to be back to its long-term steady state level of 1.8%.  The Fed expects this stronger short-term growth to lower unemployment to 3.6% (from 3.9% today) by the end of the year, and bottom at 3.5% in 2019 where it will remain in 2020. Because the Fed estimates the natural rate of unemployment (the lowest level that doesn’t increase inflation via stronger wage growth) to be 4.5% the Fed thinks that its key inflation metric, Core PCE, will hit 2.1% in 2019 and remain there through 2021. Today core PCE is at 2.0%, precisely the Fed’s target long-term rate, and has remained stable at this level for four straight months.

So what does this somewhat disappointing long-term economic forecast mean for interest rates?

Fed’s Forecast For Short-Term Interest Rates

Each Fed meeting brings with it an updated “dot plot” or graphical representation of where each FOMC member (there are 12 who vote on rate hikes) thinks the FFR will wind up by the end of each year.

Source: FOMC

The June meeting saw the Fed deliver its 3rd rate hike this year (and 8th this tightening cycle) as planned. The FFR is now between 2 and 2.25%. The Dot plot became slightly more hawkish and shows one more hike this year (likely December), three next year (likely March, June and December), and two in 2020. That’s a total of 6 more rate hikes, which would mean 14 hikes this tightening cycle and an FFR that peaks at 3.5% to 3.75%. Then there’s one rate cut expected in 2021 and another one in 2022. Basically the Fed is indicating that it thinks that low unemployment might put the economy at risk of rising wages that might keep inflation slightly higher than it likes, even with growth slowing back to a sub 2% rate. Effectively the Fed’s current plan is to indirectly raise consumer lending rates by 1.5%, in order to keep the economy from overheating by pushing interest rates far above its estimated neutral rate of 2.9%. The neutral rate is the FFR at which the FOMC’s consensus is that the economy will neither be slowed, or accelerated (thus neutral).

So does this mean investors (and borrowers) need to worry about rising rates? Not necessarily. That’s because the dot plot is merely the equivalent of corporate earnings guidance. It’s a plan and forecast but can always change over time. In other words, if the data shows inflation is lower than expected (like core PCE stays stuck at 2.0%) then the Fed isn’t likely to go through with its planned 6 more rate hikes. The bond futures market, where large financial institutions bet billions via interest rate futures (to hedge their rate risk), shows the world’s capital markets think the Fed will have to stop hiking after just two, or maybe three 25 basis point increases.

Source: CME Group

That’s great news for anyone worried about the Fed inverting the yield curve, by driving short-term rates above long-term treasury yields. Historically this has been followed by a recession 90% of the time (within 6 to 24 months). What about the common concern that rising interest rates will hurt stocks? Well you can breathe easy. That’s because the most important thing to know about interest rates is the FFR is not what stocks primarily care about.

Stock Market Mostly Cares About Long-Term Interest Rates

There’s a common misconception that Fed rate hikes hurt stocks directly. That flawed belief stems from the notion that rising interest rates will cause investors to pull money from stocks to put them into higher-yielding and risk free bonds. While that’s a plausible sounding argument in fact what the stock market cares most about is long-term interest rates like the 10 year treasury yield.

Source: St. Louis Federal Reserve

As you can see, while short-term treasury yields are indeed highly correlated with the FFR, 10 year yields are not. That’s because short-term treasury yields must compete with cash equivalents like savings accounts and money market accounts. The rates on these are indirectly linked to the FFR (thought they rise slower than the FFR). However, long-term bonds are set by the largest and most liquid bond market on earth (about $15 trillion in size) driven by institutional cash flows from pension funds, insurance companies, central banks, mutual fund companies, and sovereign wealth funds. These mostly care about the long-term inflation rate, which eats away at bond total returns (since interest payments on bonds are fixed). Currently the 10 and 30 year Treasury yields are pricing in 2.15% long-term core inflation. That means that should inflation fail to rise to that level, 10 and 30 year yields are likely to not only stay stable, but would probably pull back a bit.

According to JPMorgan Asset Management between 1963 and March 2018, stocks were not hurt by high 10 year yields as long as they were at 5% or below. In order for 10 year yields to rise to 5% core inflation would have to rise about 3% to 5%. That’s nowhere near what either the FOMC or bond markets think is possible, given the slowing growth rates the US is likely facing due to 10,000 baby boomers retiring each day (and thus shrinking the labor market).

What implications does that have for stocks? Well for one think it means that long-term rates are likely to remain near current levels for much of 2018, when economic growth and rising inflation risk will be the highest. But as we’ve seen over the past few months (Q3 was the strongest for the market since Q4 2013), stocks are currently not being hurt by 3% 10 year yields. As long as corporate earnings continue to grow at a brisk pace (20% in 2018 and 10% projected 2019) the bull market is very likely to continue.

What about high-yield “bond alternatives” like utilities, REITs and dividend stocks in general? Well while these can be sensitive to the 10 year yield in the short-term (mostly impacted by the speed that rates rise), over the long-term there is no correlation between total returns and long-term interest rates. That’s because all stocks, REITs included, ultimately trade off fundamentals, specifically cash flow and dividends. If the economy is strong enough to justify rising long-term rates, then these companies pass on rising costs (higher inflation) in the form of rent or price increases that allow their cash flow and payouts to keep growing. That ultimately  drives up share prices.

This holds true as long as 10 year yields are 5% or below. And since rates are very unlikely to go above those levels, investors, and dividend investors in particular, have little reason to fear the Fed’s planned (but unlikely) six additional rate hikes.

Bottom Line: The Fed’s Future Rate Hikes Are Not Set In Stone And Are No Reason To Adjust Your Long-Term Portfolio Strategy

The reason the Fed produces its dot plots and does its quarterly conference calls is to give capital markets clear guidance of where it thinks the economy, inflation, and the FFR are going. But the Fed isn’t clairvoyant. So remember that dot plots and economic forecasts are merely educated guesstimates that are a rough guide, never a promise or threat. The Fed’s interest rate decisions ultimately are data driven, which is why you should avoid making short-term investing decisions based on Fed meetings, or what the media reads into them.

In the end long-term interest rates are what the market, including dividend stocks, care most about. And even if the 10 year yield were to rise a bit, ultimately that won’t hurt high-yield stocks like REITs, utilities, or blue chip income investments. Which means the best thing you can do right now is stick to your long-term investment plan, and not lose sleep over the Fed’s planned six additional rate hikes; which are unlikely to even happen.

‹ Older posts
Newer posts ›

©2025 StockNews.com
About Us | Contact Us | Performance | Privacy Policy | Terms of Use | Supplemental Terms

Copyright © 2025. Market data provided is at least 10-minutes delayed and hosted by Barchart Solutions.
Information is provided 'as-is' and solely for informational purposes, not for trading purposes or advice, and is delayed. To see all exchange delays and terms of use, please see disclaimer.

This site is protected by reCAPTCHA and the Google Privacy Policy and Terms of Service apply.

Information contained on this website maintained by Magnifi Communities LLC is provided for educational purposes only and are neither an offer nor a recommendation to buy or sell any security, options on equities, or cryptocurrency. Magnifi Communities LLC and its affiliates may hold a position in any of the companies mentioned. Magnifi Communities LLC is neither a registered investment adviser nor a broker-dealer and does not provide customized or personalized recommendations. Any one-on-one coaching or similar products or services offered by or through Magnifi Communities LLC does not provide or constitute personal advice, does not take into consideration and is not based on the unique or specific needs, objectives or financial circumstances of any person, and is intended for education purposes only. Past performance is not necessarily indicative of future results. No trading strategy is risk free. Trading and investing involve substantial risk, and you may lose the entire amount of your principal investment or more. You should trade or invest only “risk capital” - money you can afford to lose. Trading and investing is not appropriate for everyone. We urge you to conduct your own research and due diligence and obtain professional advice from your personal financial adviser or investment broker before making any investment decision.

StockNews, a division of TIFIN Group LLC, is affiliated with Magnifi LLC (“Magnifi”) via common ownership. Affiliates of Magnifi will receive cash compensation for referrals of clients who open accounts with Magnifi. Due to this compensation, a conflict of interest exists since StockNews has an incentive to recommend Magnifi. Please see Magnifi’s Form ADV for additional information about fees and charges that may apply.