While the U.S. economy seems to be maintaining steady, moderate growth, most of the rest of the globe’s economy is deteriorating towards recessionary levels.
Can the U.S. decouple from the rest of the world and avoid the same fate? The bond market, which saw the yield curve invert this morning, is shouting a resounding, “No!”
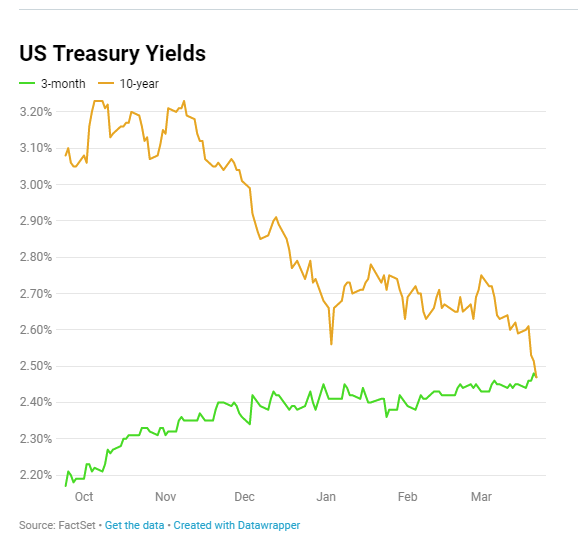
Between an increasingly dovish Fed, other Central Banks maintaining quantitative easing policies and a slew of weak economic data out of Europe, the10-year U.S. morning yield has dropped some 25 basis points in the past three weeks and now stands at 2.47%, — the lowest level in nearly three years.
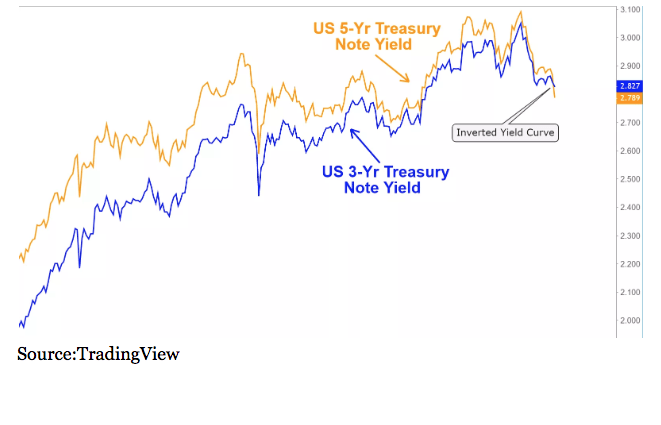
We had almost had an inversion back in early December when saw the 3-year vs. 5-year invert, which sent prognosticators into overdrive with predictions the economy is heading towards recession sooner than later and sending stocks back into a nose dive.
Fed Head Jay Powell turned fully dovish, announcing that he was putting rate increases on hold and slowing the pace of balance sheet reductions.
This allowed both stocks and bonds to sigh, which sparked a buying frenzy in the former and a widening in yield spreads, as 2019 began.
It was also noted that the 3-month, 10-year spread, which is the true benchmark for labeling that the curve “inverted,” while getting down to a slim 11 basis points — it did not truly invert.
That changed this morning as the 3-month T-bill is currently yielding 2.49% or 2, a basis higher than the 10-year Treasury’s 2.47% yield.
As you can see, nearly all of the convergence is the result of a decline in the 10-year, which accelerated in the past few days, following Powell’s even more dovish statements in which he promised not to raise rates until 2020.
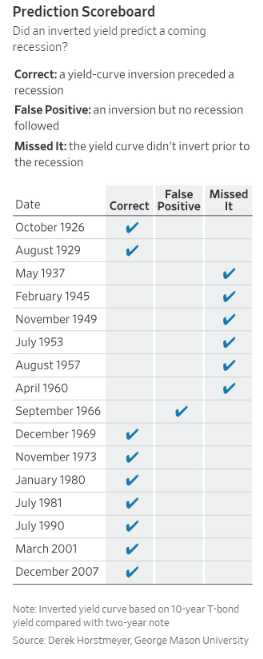
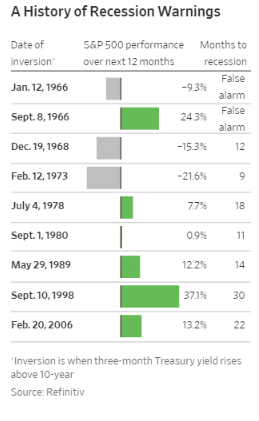
The reason why a yield inversion causes such consternation is the fact that nine of the last 11 recessions have been preceded by an inverted yield curve.
While the inversion has indeed preceded recessions on most occasions, it is not a fail-safe predictor, or even a necessary requirement.
Note, not only have there been ‘false flags,’ but there have been six recessions without an inversion occuring.
It should also be noted that the timing from inversion until the onset of a recession, usually considered two consecutive quarters of negative GDP, can vary widely.
While the average is 14 months, which would suggest April 2021 for a downturn, the range has been from as short as 8 months, and as long as 3 years.
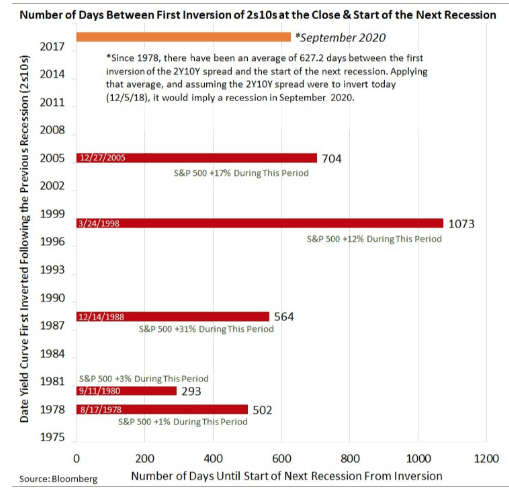
Furthermore, this not say that stocks can’t resume the rally. Surprisingly, following a yield curve inversion the stock market has continued to gain until after such an event and has peaked much later, after providing a return of around 21% on average over the following 12 months.
Why does the inversion predict an economic slowdown? The thinking is that as we enter the economic cycle’s late stage — and recent signs such as a slowdown in housing and auto sales as well as oil and copper price declines and overall slowing global growth —would warrant low long-term rates as investors choose the safety of bonds over investing in expansion.
One big difference between now and past inversions is that rates are still historically low; the inversion of 2006 saw the 10-year yielding over 6.5% compared to the current 4%, meaning even a slight inversion doesn’t create a huge change in the cost of money.
So with the Fed firmly on hold and rates remaining historically low, the hope is that both corporate and consumer spending, will indeed help the U.S. avoid a recession. This morning’s existing home sales data surged by 11% to the highest level in over 3 years.
About the Author: Steve Smith

Steve has more than 30 years of investment experience with an expertise in options trading. He’s written for TheStreet.com, Minyanville and currently for Option Sensei. Learn more about Steve’s background, along with links to his most recent articles. More...
9 "Must Own" Growth Stocks For 2019
Get Free Updates
Join thousands of investors who get the latest news, insights and top rated picks from StockNews.com!


