

Seems like every day brings an article by another analyst asking if the next gold bull run has already started. Or is about to… Your friendly Gold Enthusiast believes it has, but as with the start of all bull markets, one needs to be careful. As the old traders say, everything is timing. Put all your money in too early and you’ll either be dragged down by an early correction or get stuck waiting while it seems everything except what you’re in goes up.

Certainly, the last 3 months’ performance by gold could lead you to believe the bull is started. But is gold really up, as in WAY UP? Let’s look at a 1-year chart of GLD, our easy-trading gold proxy, to see.
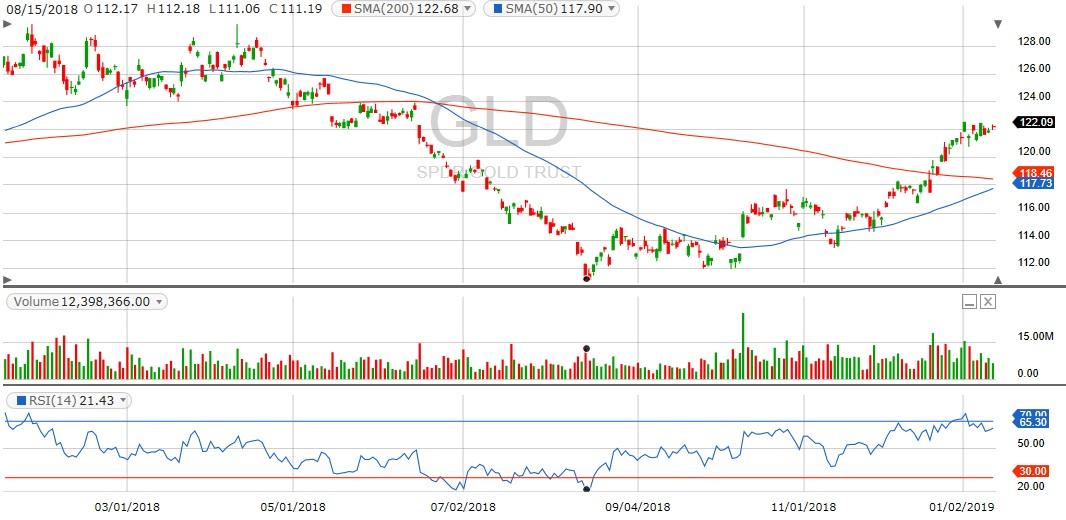
(credit: Fidelity.com)
What this chart shows is that gold – priced in US Dollars – has come a long way since the August low. In GLD terms it’s up 9.9%. Not a bad 5-month return, but not setting the house afire in the context of the equity market’s recent upside performance.
As is so often true, the important bit here is hidden in the details. We tossed in “priced in US Dollars” because analysts have been noting lately that gold is at or near all-time highs in many currencies around the world. Only in a relative handful of “strong” currencies is gold not at or near all-time highs – currencies like the Japanese Yen, British Pound, the Euro, and of course the US Dollar.
Every time this has happened that your Gold Enthusiast knows about, a bull run in gold was not far behind. It’s definitely time for us to keep an eye on 1300 and then 1400 USD for international gold, with the usual bull market buying strategies.
And a small bonus for those who have read this far. On the chart of GLD above note that the 200 and 50-day SMAs are close to a bullish “golden cross.” In this case, the golden cross would certainly earn its name.
Signed,
The Gold Enthusiast
DISCLAIMER: The author is currently long the gold market via small positions in NUGT, JNUG, and a handful of junior mining stocks. He may add to these positions in the next 48 hours.
About the Author: Mike Hammer
For 30-plus years, Mike Hammer has been an ardent follower, and often-times trader, of gold and silver. With his own money, he began trading in ‘86 and has seen the market at its highest highs and lowest lows, which includes the Black Monday Crash in ‘87, the Crash of ‘08, and the Flash Crash of 2010. Throughout all of this, he’s been on the great side of winning, and sometimes, the hard side of losing. For the past eight years, he’s mentored others about the fine art of trading stocks and ETFs at the Adam Mesh Trading Group More...
9 "Must Own" Growth Stocks For 2019
Get Free Updates
Join thousands of investors who get the latest news, insights and top rated picks from StockNews.com!
Top Stories on StockNews.com

Best & Worst Performing Mega Cap Stocks for July 9, 2025
AEXAY leads the way today as the best performing mega cap stock, closing up 13.49%.
Best & Worst Performing Mega Cap Stocks for July 8, 2025
AEXAY leads the way today as the best performing mega cap stock, closing up 13.49%.
Best & Worst Performing Mega Cap Stocks for July 7, 2025
AEXAY leads the way today as the best performing mega cap stock, closing up 13.49%.
Best & Worst Performing Mega Cap Stocks for July 4, 2025
AEXAY leads the way today as the best performing mega cap stock, closing up 13.49%.