

As of this midday writing, major stock indices are all up over 1.5%, — their best day in four months. This comes on the heels of consecutive weeks down, six for the Dow, the longest losing streak in 6 years. The question now: Is this a dead cat bounce from oversold conditions, or the renewal of the bull market?
To determine the difference, let’s drill into some of the market, technical and sentiment reading. No animals were harmed during this analysis.
The first thing I noticed over the past few weeks is that the decline has been very orderly. A drop of about 6% over the past five weeks only had one day with a 2%-plus decline, and still left the indices up some-10% for the year-to-date. The selling was steady, but never showed signs of panic.
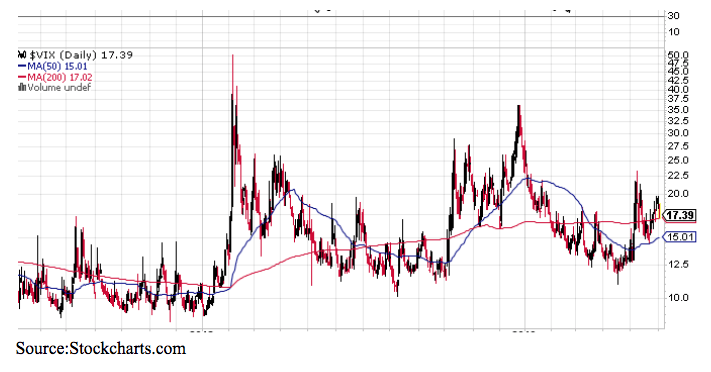
This was reflected in the VIX , which barely tipped 20 on the initial days of the sell-off, and is currently back at high school age. While the declines in some sectors and stocks have been more severe (ie semi’s off 16%, energy down 27%), investors have mostly remained pretty calm, seemingly confident that the economy won’t be derailed.
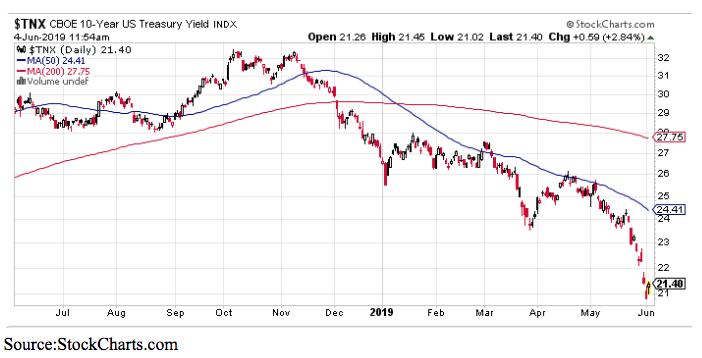
By contrast, the bond market, and to some extent currencies and some commodities, have been quite disorderly, bordering on panic, suggesting there’s a crisis on the horizon. You can see the cascade in the 10- Year Treasury, as yields dropped to near 2%, before today’s retreat higher.
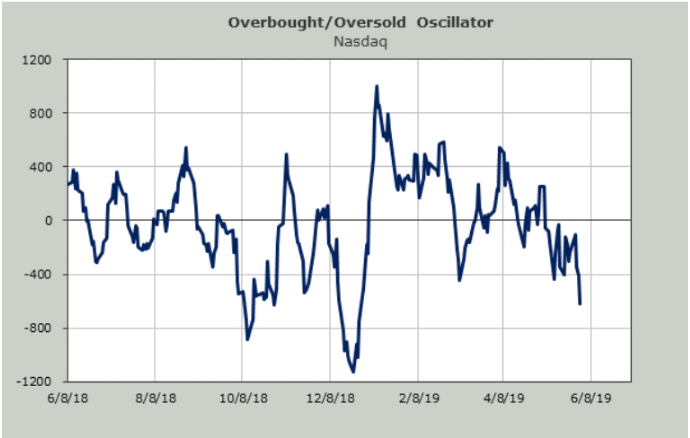
It’s no surprise that the Nasdaq, which suffered some of the largest losses, with tech stocks tied to China’s supply chain and recent antitrust issues, which are enjoying a bigger bounce today with the index up over 2%
But, despite the recent decline it has never reached oversold levels. I’m concerned today’s bounce merely alleviates the near-term pressure and it will turn lower again in the coming days.
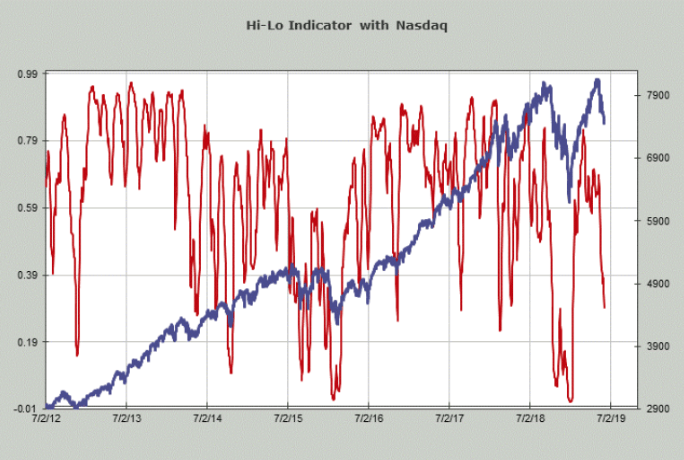
You can see that the new lows never hit an extreme that marked prior bottoms. Some of this may just be because many of the names had big 20%-50% gains, during the first few months of the year — even a 20% decline didn’t hit a new low. That’s just math.
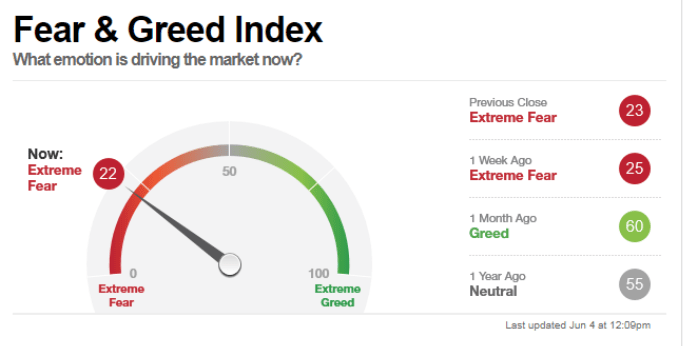
From a sentiment standpoint, investors have clearly become more cautious but are still far the capitulation levels of below 15 that the Fear & Greed Indicator typically hits at major market lows.
Given that none of the readings hit major extremes and the major indices are still just 6% off the all-time highs I’d view today’s action as simply a bounce from moderately oversold conditions.
Proceed with caution.
About the Author: Steve Smith

Steve has more than 30 years of investment experience with an expertise in options trading. He’s written for TheStreet.com, Minyanville and currently for Option Sensei. Learn more about Steve’s background, along with links to his most recent articles. More...
9 "Must Own" Growth Stocks For 2019
Get Free Updates
Join thousands of investors who get the latest news, insights and top rated picks from StockNews.com!
Top Stories on StockNews.com

Best & Worst Performing Mega Cap Stocks for July 10, 2025
AEXAY leads the way today as the best performing mega cap stock, closing up 13.49%.
Best & Worst Performing Mega Cap Stocks for July 9, 2025
AEXAY leads the way today as the best performing mega cap stock, closing up 13.49%.
Best & Worst Performing Mega Cap Stocks for July 8, 2025
AEXAY leads the way today as the best performing mega cap stock, closing up 13.49%.
Best & Worst Performing Mega Cap Stocks for July 7, 2025
AEXAY leads the way today as the best performing mega cap stock, closing up 13.49%.