

Alcoa Corp (AA - Get Rating) is a vertically integrated aluminum company whose operations include bauxite mining, alumina refining, and the manufacture of primary aluminum. It is the world’s largest bauxite miner and alumina refinery by production volume, and its profits are closely tied to prevailing commodity prices along the aluminum supply chain.
The company recently reported a very strong third quarter. In fact, AA reported its highest-ever quarterly net income of $337 million. It also generated $3.1 billion in sales due to higher alumina and aluminum prices. AA is the world’s largest producer of alumina, which is used to produce aluminum.
AA had $1.4 billion in cash as of the end of the third-quarter, compared to short term debt of only $1 million. In the third quarter, earnings rose from -$1.17 to $2.05 and sales jumped 31% year over year. Analysts expect sales to jump another 43.4% year over year in the current quarter, while earnings are expected to surge 765.4% year over year in the same period.
This has led to a Growth Grade of B in our POWR Ratings system. The stock looks extremely undervalued with a forward P/E of only 6.97. AA was showing bullish momentum at the beginning of the month, but has since reversed course and is now trending down as shown in the chart below.
Take a look at the 1-year chart of AA below with the added notations:
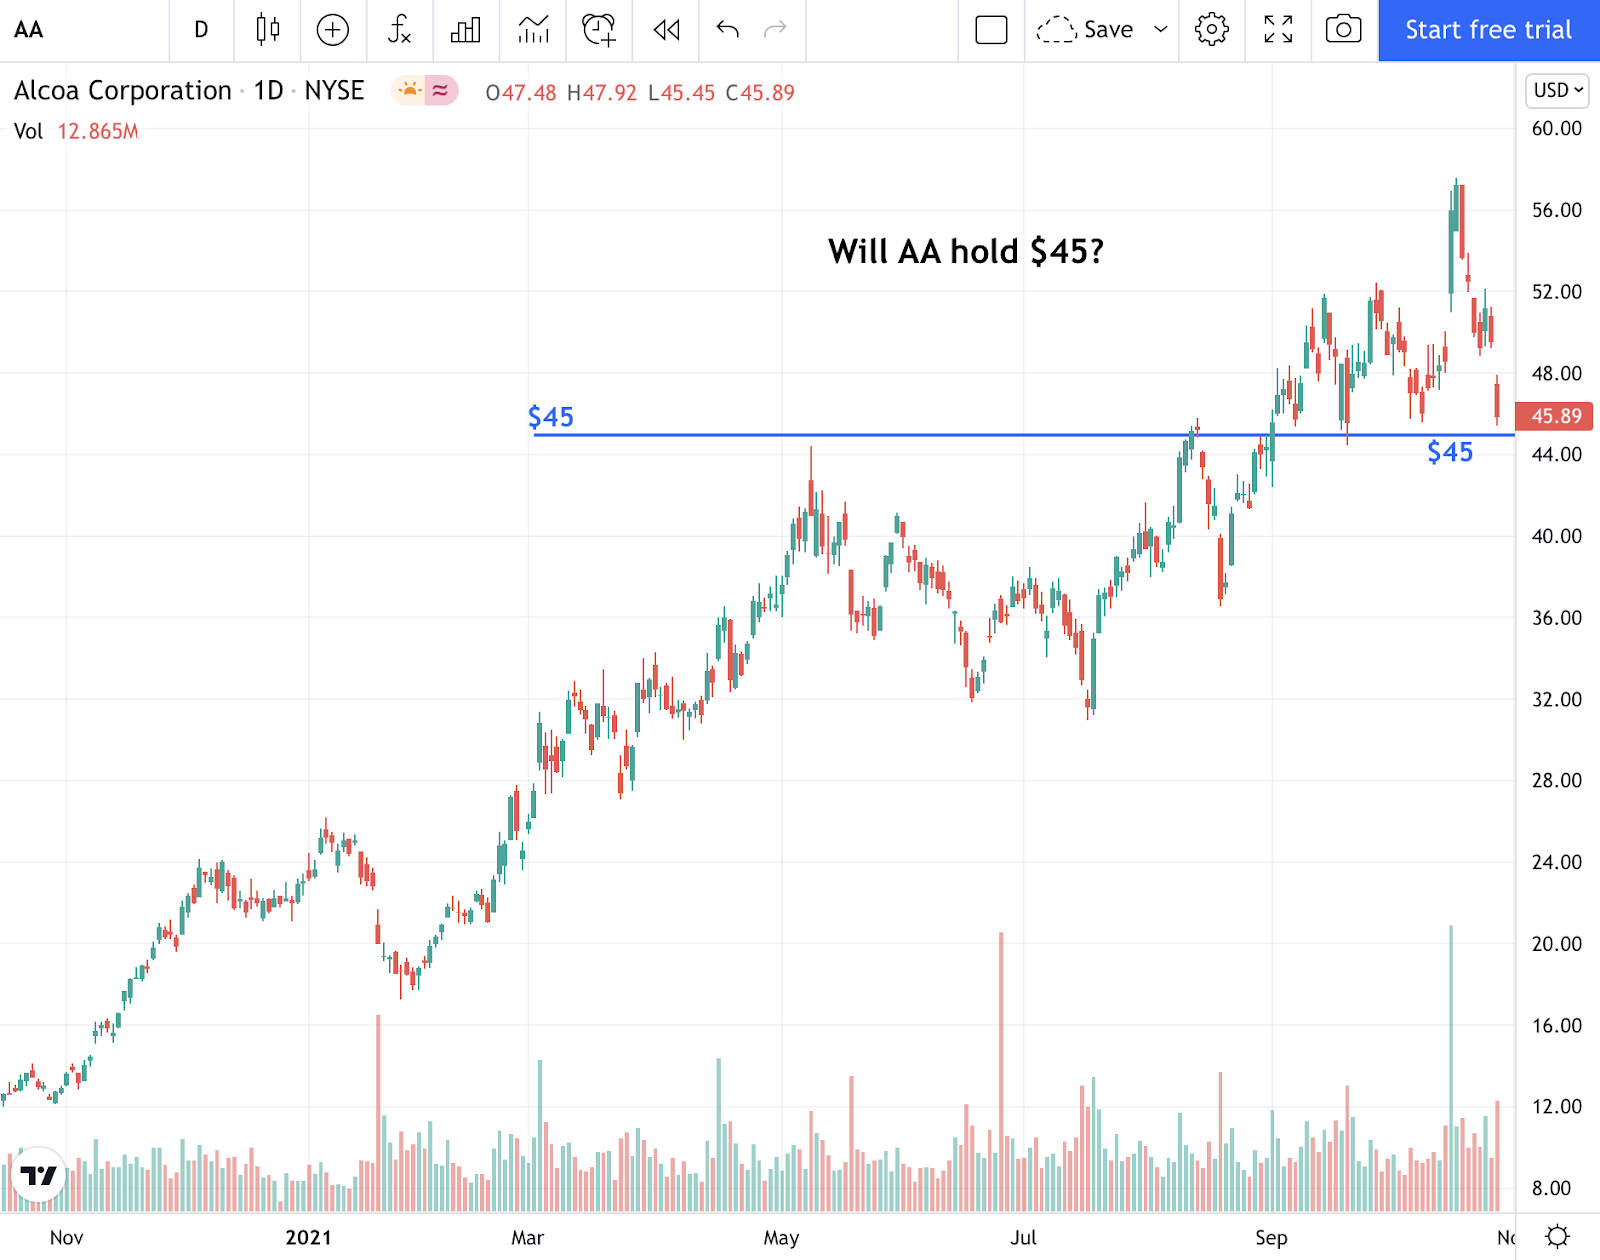
Over the past six months, AA has formed an important level to watch at the $45 (blue) mark, as that level has provided both support and resistance. AA is on its way back down to that level now.
Click Here to Read the Greatest Trading Book Ever Written
A trader could enter a short trade on a break below the $45 level with a protective stop placed above the entry point.
Want to Discover More Great Trades?
What is better than finding the 1 attractive stock in this article?
Discovering 5 timely trades…like the ones in this new special report. Click below to claim your free copy now!
Want More Great Investing Ideas?
AA shares were trading at $46.50 per share on Thursday morning, up $0.61 (+1.33%). Year-to-date, AA has gained 101.74%, versus a 22.99% rise in the benchmark S&P 500 index during the same period.
About the Author: Christian Tharp

I am an expert stock market coach having helped over 4000 beginner and advanced traders & investors from around the world take control of their financial futures. I also write stock market related articles for the Adam Mesh Trading Group and Yolo Publishing. More...
More Resources for the Stocks in this Article
| Ticker | POWR Rating | Industry Rank | Rank in Industry |
| AA | Get Rating | Get Rating | Get Rating |


