
Over the past three months, Alkermes (ALKS - Get Rating) has been in a sideways trading range and has formed a rectangle pattern.
ALKS is a fully integrated global biotechnology company that applies its proprietary technologies to research, develop, and commercialize pharmaceutical products designed for unmet medical needs in major therapeutic areas.
The company has a diversified portfolio of drugs that target central nervous system disorders such as addiction, depression, multiple sclerosis, and schizophrenia. Revenues are being primarily driven by Vivitrol and Aristada. Vivitrol treats alcohol and opioid dependence and Aristada treats schizophrenia. ALKS also has a strong drug pipeline.
ALKS has a long term debt of $373 million, but cash of $533 million as of the end of the last quarter. The company’s current ratio of 3.0 indicates enough cash on hand to handle short term debt. Though ALKS negative net margin is worrisome.
The company has shown stable sales growth and is expected to grow revenues 11.0% next year. EPS is expected to grow 340% over the same time period. Keep a close eye on ALKS this week, as the stock reports its latest quarterly results on October 29th. The consensus estimate is -$0.14.
In terms of valuation, the company has a Price to Sales ratio of 2.2 and a Price to Book ratio of 2.4. Both numbers are below the industry average. The stock has shown bearish momentum over the short, mid, and long term and a grade of “D” for Trade Grade in our POWR Ratings system, which brings us to its chart.
Take a look at the 1-year chart of ALKS below with added notations:
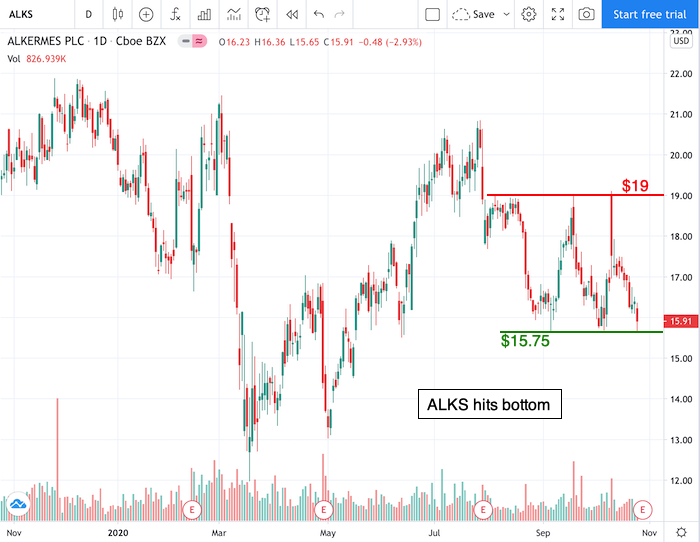
Chart of ALKS provided by TradingView
Over the past couple of months, ALKS has moved into a sideways trading range. While in the range, the stock has formed a resistance level at $19 (red), and a level of support at around $15.75 (green).
The stock is looking like it might break the support level soon. Therefore, traders should keep a close eye on ALKS for a possible short trade if the stock breaks below $15.75.
Want to Discover More Great Trades?
I have explored virtually every flavor of technical analysis and chart pattern known to mankind. The sad fact is that the vast majority of them don’t work at all.
That is why I recently put together this special report to help investors focus on the only 5 chart patterns that matter…the ones that lead to the most timely and profitable stock trades. Click below to get your copy now!
5 WINNING Stock Chart Patterns
Have a good trading day!
Good luck!
Christian Tharpe, CMT
ALKS shares were trading at $15.66 per share on Tuesday morning, down $0.25 (-1.57%). Year-to-date, ALKS has declined -23.24%, versus a 7.01% rise in the benchmark S&P 500 index during the same period.
About the Author: christian

Christian is an expert stock market coach at the Adam Mesh Trading Group who has mentored more than 4,000 traders and investors. He is a professional technical analyst that is a certified Chartered Market Technician (CMT), which is a designation awarded by the CMT Association. Christian is also the author of the daily online newsletter Todays Big Stock. More...
More Resources for the Stocks in this Article
| Ticker | POWR Rating | Industry Rank | Rank in Industry |
| ALKS | Get Rating | Get Rating | Get Rating |


