
AMC Entertainment Holdings Inc. (AMC - Get Rating) is involved in the theatrical exhibition business. It owns, operates or has interests in theatres located in the United States and Europe. The company provides best-in-class amenities such as plush, power recliners, MacGuffins full bars, AMC Dine-In Theatres, premium presentation.
AMC has become one of the top meme stocks as Reddit traders forecast a large turnaround for the company. The retail investors expect a short squeeze and consumers heading back to movie theaters. While the company is recovering, its revenue is still considerably lower than its 2017 through 2019 numbers.
While its current cash balance of $1.6 billion is much higher than its short-term debt of only $29 million, it is considerably lower than its massive long-term debt of $10.3 billion. Sales have lost an average of 34.7% per year over the last three years.
However, revenues are expected to rise 581.3% year over year in the current quarter leading to a Growth Grade of B in our POWR Ratings system. The stock looks very overvalued, though, with a price to sales ratio of 9.6. AMC was showing bullish momentum in June only to fall in July. Performance has been mixed since. This is evident in the chart below.
Take a look at the 1-year chart of AMC below with my added notations:
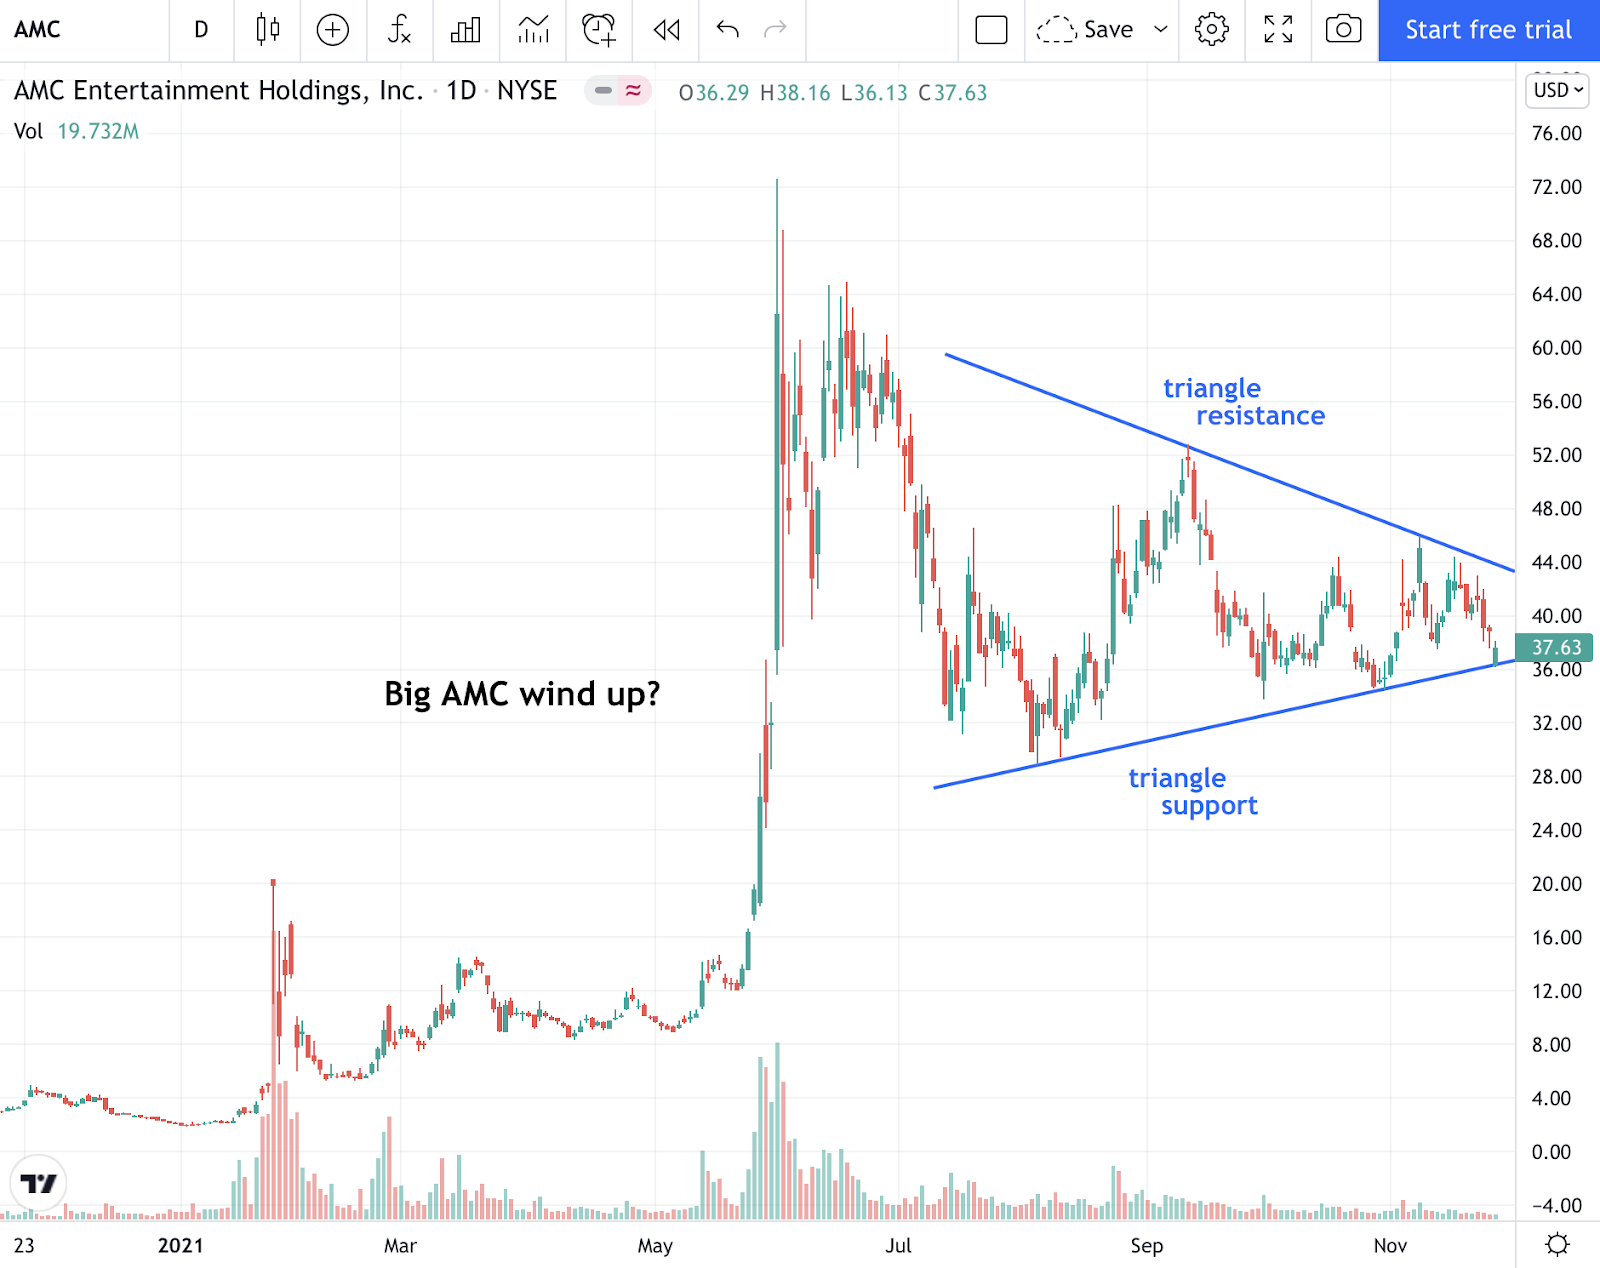
AMC is consolidating within a common chart pattern known as a symmetrical triangle. A down trending resistance combined with an up-trending support forms the triangle pattern (blue). Since there is no true way to know which way the stock will break, traders will often wait for the breakout or breakdown before entering a trade.
Click Here to Read the Greatest Trading Book Ever Written
A trader could enter a long position on a break above the down trending resistance with a protective stop set under the entry level. However, if the stock were to break below the trend line support, a short trade could be entered with a protective stop above the trend line.
Want to Discover More Great Trades?
What is better than finding the 1 attractive stock in this article?
Discovering 5 timely trades…like the ones in this new special report. Click below to claim your free copy now!
Want More Great Investing Ideas?
AMC shares were trading at $37.78 per share on Monday morning, up $0.15 (+0.40%). Year-to-date, AMC has gained 1,682.08%, versus a 25.15% rise in the benchmark S&P 500 index during the same period.
About the Author: Christian Tharp

I am an expert stock market coach having helped over 4000 beginner and advanced traders & investors from around the world take control of their financial futures. I also write stock market related articles for the Adam Mesh Trading Group and Yolo Publishing. More...
More Resources for the Stocks in this Article
| Ticker | POWR Rating | Industry Rank | Rank in Industry |
| AMC | Get Rating | Get Rating | Get Rating |


