AMC Entertainment Holdings, Inc. (AMC): Price and Financial Metrics
GET POWR RATINGS... FREE!
AMC POWR Grades
- AMC scores best on the Momentum dimension, with a Momentum rank ahead of 71.49% of US stocks.
- AMC's strongest trending metric is Growth; it's been moving down over the last 177 days.
- AMC ranks lowest in Stability; there it ranks in the 1st percentile.
AMC Stock Summary
- The capital turnover (annual revenue relative to shareholder's equity) for AMC is -1.49 -- better than only 4.65% of US stocks.
- AMC's equity multiplier -- a measure of assets relative to shareholders'equity -- is greater than that of just 3.48% of US stocks.
- In terms of volatility of its share price, AMC is more volatile than 95.35% of stocks we're observing.
- Stocks that are quantitatively similar to AMC, based on their financial statements, market capitalization, and price volatility, are OFC, BRX, AHH, HHC, and NSA.
- AMC's SEC filings can be seen here. And to visit AMC ENTERTAINMENT HOLDINGS INC's official web site, go to www.amctheatres.com.
AMC Valuation Summary
- In comparison to the median Consumer Cyclical stock, AMC's price/sales ratio is 65.71% lower, now standing at 0.6.
- AMC's price/sales ratio has moved down 0 over the prior 113 months.
Below are key valuation metrics over time for AMC.
Stock | Date | P/S | P/B | P/E | EV/EBIT |
---|---|---|---|---|---|
AMC | 2023-03-22 | 0.6 | -0.9 | -2.3 | -18.4 |
AMC | 2023-03-21 | 0.6 | -0.9 | -2.3 | -18.5 |
AMC | 2023-03-20 | 0.6 | -0.8 | -2.3 | -18.4 |
AMC | 2023-03-17 | 0.6 | -0.8 | -2.2 | -18.3 |
AMC | 2023-03-16 | 0.6 | -0.9 | -2.3 | -18.5 |
AMC | 2023-03-15 | 0.6 | -0.8 | -2.2 | -18.3 |
AMC Growth Metrics
- The 2 year price growth rate now stands at 109.02%.
- The 3 year cash and equivalents growth rate now stands at 508.91%.
- Its 5 year net income to common stockholders growth rate is now at -2491.91%.

The table below shows AMC's growth in key financial areas (numbers in millions of US dollars).
Date | Revenue | Operating Cash Flow | Net Income to Common Stock |
---|---|---|---|
2022-09-30 | 4,092.2 | -548.7 | -820.3 |
2022-06-30 | 3,887 | -439 | -817.6 |
2022-03-31 | 3,165.3 | -596.2 | -1,039.6 |
2021-12-31 | 2,527.9 | -614.1 | -1,269.1 |
2021-09-30 | 1,518.7 | -1,018.5 | -2,080.5 |
2021-06-30 | 875 | -1,260.3 | -2,762.1 |
AMC's Quality Factors
The “Quality” component of the POWR Ratings focuses on 31 different factors of a companies fundamentals and operational strength. Here are some key insights as we drill into the specifics of these quality attributes.- AMC has a Quality Grade of D, ranking ahead of 15.82% of graded US stocks.
- AMC's asset turnover comes in at 0.081 -- ranking 39th of 44 Entertainment stocks.
- CNK, MCS, and RDI are the stocks whose asset turnover ratios are most correlated with AMC.
The table below shows AMC's key quality metrics over time.
Period | Asset Turnover | Gross Margin | ROIC |
---|---|---|---|
2021-06-30 | 0.081 | -1.136 | -0.142 |
2021-03-31 | 0.042 | -2.640 | -0.154 |
2020-12-31 | 0.114 | -0.732 | -0.249 |
2020-09-30 | 0.215 | -0.140 | -0.196 |
2020-06-30 | 0.301 | 0.038 | -0.147 |
2020-03-31 | 0.403 | 0.140 | -0.110 |
AMC Price Target
For more insight on analysts targets of AMC, see our AMC price target page. And for a list of of all stocks sorted by upside potential based on analyst target price, see our Top Price Target page.
Average Price Target | $5.44 | Average Broker Recommendation | 2.33 (Moderate Sell) |
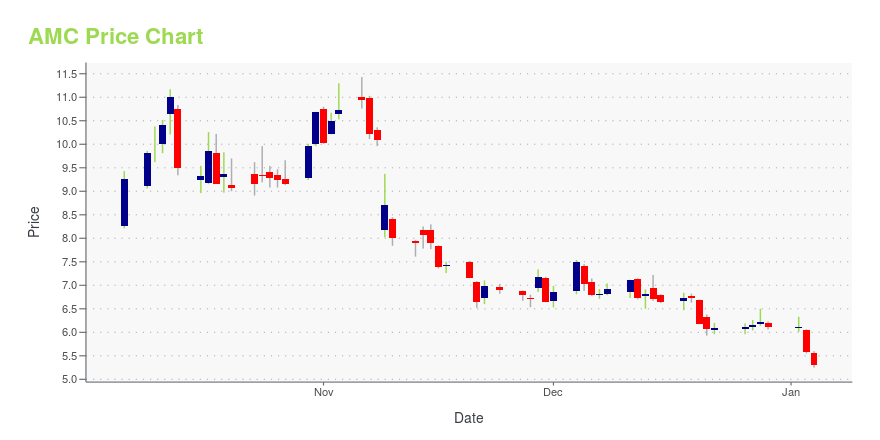
AMC Stock Price Chart Interactive Chart >
AMC Price/Volume Stats
Current price | $5.01 | 52-week high | $34.33 |
Prev. close | $4.97 | 52-week low | $3.77 |
Day low | $4.87 | Volume | 19,003,200 |
Day high | $5.05 | Avg. volume | 35,505,328 |
50-day MA | $5.45 | Dividend yield | N/A |
200-day MA | $8.71 | Market Cap | 2.59B |
AMC Entertainment Holdings, Inc. (AMC) Company Bio
AMC Entertainment Holdings owns, operates, or holds interest in 348 movie theatres with a total of 4,960 screens primarily in North America. The company was founded in 1920 and is based in Leawood, Kansas.
Latest AMC News From Around the Web
Below are the latest news stories about AMC ENTERTAINMENT HOLDINGS INC that investors may wish to consider to help them evaluate AMC as an investment opportunity.
S&P 500: The best and worst performers so far in 2023Yahoo Finance Live anchors Rachelle Akuffo and Brad Smith break down the best and worst performers of the S&P 500 in the first quarter of 2023. |
3 Short-Squeeze Stocks That Could Skyrocket in 2023These short-squeeze stocks have potential catalysts that could turn the tide this year despite the negative outlook. |
Is AMC Stock A Buy Or Sell Now? Here's What Fundamentals, Chart Action, Fund Ownership Metrics SayIn 2020, AMC lost $16.15 a share. Over the past five quarters, the company's sales have shrunk 22% to 99% vs. year-ago levels. Such results normally devastate most companies. |
AMC Entertainment (AMC) Stock Sinks As Market Gains: What You Should KnowIn the latest trading session, AMC Entertainment (AMC) closed at $4.97, marking a -0.6% move from the previous day. |
Why Are Tech Companies Ramping Up Investment in Cinemas?Apple and Amazon have both announced plans to ramp up spending on movies. Moving into the cinema space could be an attempt to boost streaming and other services. |
AMC Price Returns
1-mo | -17.87% |
3-mo | 23.10% |
6-mo | -27.18% |
1-year | -78.50% |
3-year | 91.22% |
5-year | -57.11% |
YTD | 23.10% |
2022 | -85.04% |
2021 | 1,183.02% |
2020 | -70.54% |
2019 | -36.60% |
2018 | -7.75% |
Continue Researching AMC
Here are a few links from around the web to help you further your research on Amc Entertainment Holdings Inc's stock as an investment opportunity:Amc Entertainment Holdings Inc (AMC) Stock Price | Nasdaq
Amc Entertainment Holdings Inc (AMC) Stock Quote, History and News - Yahoo Finance
Amc Entertainment Holdings Inc (AMC) Stock Price and Basic Information | MarketWatch
Loading social stream, please wait...